GUNNER24 Trade of the Day 02/06/2018
No trade setup today / New SL for the 1:3-Trade 1.2515 EURUSD position is 1.2500 / New SL for the 1:3-Trade 51.10-XLU position is 49.50
Dear GUNNER24 Traders,
No trade setup today
On Wall Street, sell-off panic cycle continued on Monday. US leading index Dow Jones lost almost 1600 points - more than ever in one day, although of course we should only have the percent in mind. At the same time, the fear barometer, the VIX index, which measures the price fluctuations of the S&P 500, jumped almost 100 percent.
The slaughter continued into Tuesday and overnight the US futures have printed these intraday-lows:
Dow Jones future - 23088
NASDAQ-100 future - 6260
S&P 500 future - 2529
DAX CFD overnight indication-low is at 11690.
And then: ---- and last time I observed this obvious blatant intervention by the ECB (European Central Bank) was the day when the Britains voted for the Brexit on June, 24, 2016 and the European stock exchanges actually stood before their opening in front of the total collaps ----
immediately at the opening of the DAX future market (FDAX), unusually high buying volume kicked in which led to the fact that during the first minute of FDAX trading (7:01 GMT) the current and most probably absolute low of the day was marked.
FDAX low is at 12070.50. Actually FDAX trades at 12447.
Also EURO STOXX 50 future contract shows its daily low is made at 7:01 GMT at 3327. Currently market trades at 3421.
FTSE MIB is the leading Italian index. FTSE MIB future low arrived at 8:02 GMT, two minutes after regular open. I could go on with this list and the volume of the first 15 trading minutes is three times higher as normal everywhere. And all the important index EU futures rallied hard from the first minute of trading.
==> Think ECB stepped in again today and saved the EU stock markets and thus indirectly also the US stock futures. And this usually means that sell-off panic cycle lows are finally in! That must be so when the state intervenes...!!!!
For the likely final panic cycle lows of some leading index futures remind the figures above...
==> Normally panic cycles last 7-10 time units, exceptionally sometimes even 12/13 time units. Since Dow Jones alltime-highs we count 7 trading days. FTSE MIB is at day # 11 since 2018 top was printed. DAX alltime-high was made 10 trading days ago.
In 2016, the final lows of the year were printed:
NASDAQ-100 future - February 11th
S&P 500 future - February 11th
DAX future - February 11th
and Dow Jones future made a first important small higher year low on February, 16.
It looks like that current sell-off panic cycle timewise is nearly 100% oriented to the February 2016 panic cycle which A) finally marked the last really important lows of this stock market bull market and B) was the starting ramp of the last 2 year bull run.
==> Thus, I think that these two time-observations also indicate that was it, for now, with with the long-awaited and healthy stock market correction and that`s why the stock markets should start rising again from now on until strongest stock market period ends in May/June.
With regard to the US markets the next few days, maybe even today for the regular US open, it should usually come again to a serious test of today's overnight lows which may possibly be undercut today/tomorrow to generate a false signal resp. to trap the shorts. Such small new lower lows today/Wednesday is theoretically allowed and possible because for now we have no prove that the FED stepped in to safe the US stock markets...
Also the weekly time frame should/could test back this week lows more seriously at the end of February maybe, because the bottoming process tends to go tough after such fast sell-offs = bearish panic cycles. On the other hand, it may well come to one of the rare V-bottoms because this bull market for years has shown tremendous inner strenght!
I look for a promising trade setup tomorrow. Hopefully, then the looming important sell-off lows have solidified and the now emerging shortterm course has consolidated somewhat!
New SL for the 1:3-Trade 1.2515 EURUSD position is 1.2500 / New SL for the 1:3-Trade 51.10-XLU position is 49.50
Please secure first short gains and lower SL-Limits as advised.
GUNNER24 Trade of the Day orders for 06/02/2018:
Market: EURUSD
Orders: New Stop-Loss (SL) for the 1:3-Trade 1.2515 EURUSD position is 1.2500.
Market: Utilities Select SPDR ETF (XLU)
Orders: New Stop-Loss (SL) for the 1:3-Trade 51.10-XLU position is 49.50.
Eduard
========================================
Markets, Money Management and Trade Size
I will merely analyze the market. There are so many instruments in the world outside our GUNNNER24 Traders use to trade, and hundreds of popular ones among them, often depending on a trader’s time horizons... I don’t consider me able to adjust the market recommendations to all the popular ETFs, different CFD or futures contracts. All I’ll analyze is pure market action - the index, stock or most current contract and forex!
The trade size you should use depends.
A) On your account size:
I usually follow the rule of thumb which says, never bet more than 1% of your account size for each trade. So I avoid overtrading...
Let’s say you have got a 30.000US$ account granting you a nominal buying power of 300.000US$ up to 500.000US$ and even more, depending on your broker and instrument. In that case your trade size shouldn’t be more than 3.000US$-5.000US$ taking into account your buying power.
Another - more conservative - method is taking into account the available margin. Usually, 30.000US$ account value equals 30.000US$ available for margin trading. So the trade size is 300US$ taking into account the margin.
Within Trade of the Day I ask you not to bet more than this 1% per any trade.
The other point to consider for determining the trade size is:
B) if your trading style is rather active, supposing you regularly have 30-50 open trades, just as I have - CFD/ETF, here some stocks, there a future contract. So I often trade risky somehow, but I split the money/bets. Even in such a nice trend as the stocks are showing currently, I never ever trade too risky. I never load the boat with 70% let 90% of my account size. 50% is the maximum.
I trade for my living and for my kids and wife as well. A regular income is important. The big-bang bet isn’t! The market would win such a big-bang bet for sure!!
When I have a lot of open trades, maybe up to this 50% of my account size/available margin I avoid trading more. So if you are an active trader having a lot of trades running at rev limiter (50% account size) please avoid trading even though we/I give you some fresh recommendations, because this would rise YOUR risk!... During the test phase that happened frequently. We had 3-5 open trades sometimes and that’s why it’s elementary important that we/you have to use tight SL. Order management is absolutely crucial for Trade of the Day.
You’ll have to place really each and every order accordingly, you know. Forgetting only one time the SL would make this trade getting worse and worse…
========================================
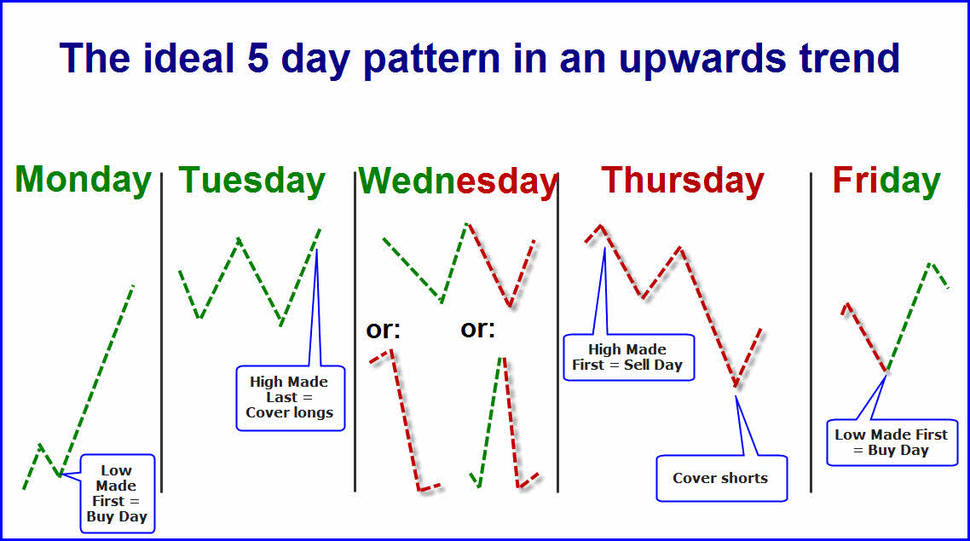
Based on the George Douglas Taylor Trading Technique that I’ve been studied and originally traded for years transferring it onto the modern markets by constant observation a five day pattern of the single days of the week has resulted.
The crux is not so much that the entire week has to work perfectly. Perhaps it does just at a 50% because the day patterns may shift by one or two days. In the strong upwards trends sometimes you see 4 buy days and only 1 sell day. It’s important to recognize that the day proceeds ideally-typically and to trade accordingly.
My personal trading style has always been the contrary to that of the crowds because the crowds always loose. Especially in gold and silver trading I like to buy the corrections Monday to Wednesday and on Friday if the day patterns correspond with some important GUNNER24 Signals.
I use to go short intraday just on Thursday when the week high is sold off AND provided that the corresponding GUNNER24 Setups signal so covering the shorts when the cycle is resumed.
The ideal five day pattern in an upwards trend – precious metals and US stock market – Do use those patterns for your intraday and swing activities!

Monday: Buy day. Strong up-day. Low established first. It often ends at the day high. Unthinkingly you may buy all the intraday corrections because the week high comes later in the course of the week.
Tuesday: Buy day. Weaker up-day. A higher high is produced. As early as now the crowds ponder whether the prices mightn’t run too high partially going short already. For me it’s the day when I can cover my Friday and Monday longs. In intraday I try to go long in case of corrections until the Comex opening.
Wednesday: Sell day. Actually the day for covering the longs and for the first short entry. It’s got some different forms. It closes at the same level as it had opened. Frequently at first the high is established because more and more traders short the market. Here the longs fight against the shorts. You recognize that if many teeth, many nicks, many spike candles are to be seen in the chart. On Wednesday I use to do nothing. Only at a 20 to 30% the shorter hearts are pleased because during the whole day there’s only sell-off.
Thursday: The classical sell short day. Because the Wednesdays often close as they had opened the market participants have to cover their shorts because in the beginning the market runs quickly upwards…! And frequently they turn their positions into the high direction being caught on the wrong trail again. Then the market often lays down a beautiful sell-off. In the evening mostly a strong rally follows. That’s where we cover the shorts.
Friday: Classical buy day in the upwards trend. It’s nothing for weak hands. Here’s where you buy the positions near the Thursday lows which you cover again next Tuesday/Wednesday. If you discover that the prices have steadied or even are rising a little bit by closing the five day cycle should continue in the following week.
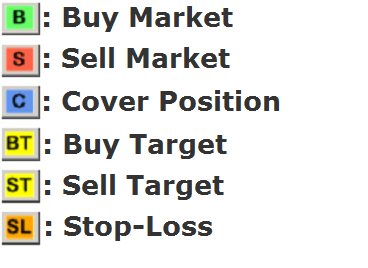
In the charts we work with the following symbols:

========================================
