Low risk shorting opportunity is at hand
Dear GUNNER24 Traders,
In course of past week we have identified current ruling gold price and time magnet in the daily time frame.
This magnet is a nearly perfect shaped circle pattern. Its an existing dominating ellipse:
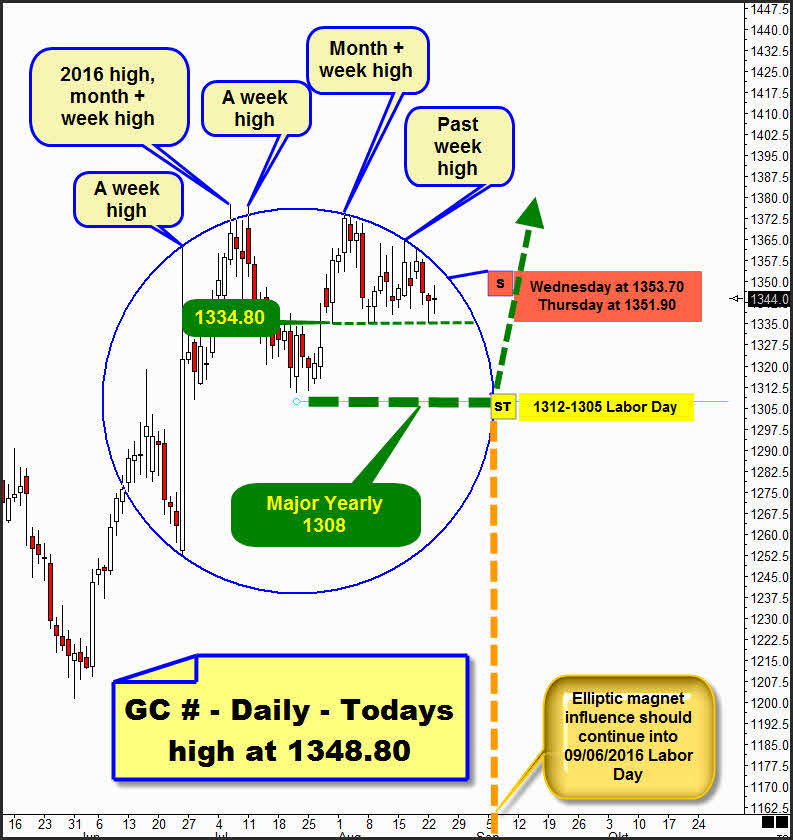
The center price of the ellipse (1307.70) is nearly equal to the very important final 1306 Mai 2016 high. We observe a lot of important negative tests at upper ellipse resistance starting with the Brexit vote high. Brexit low has tested the ellipse support = first and only ellipse support test.
Gold cycle since Brexit referendum follows/respects the ellipse as important turn magnet, all in all we observe current 2016 high at ellipse resistance, 2 monthy highs and a few week highs made at ellipse resistance. Past week highs also have arrived precisely at magnet resistance.
Well, after the early Monday sell off into obvious existing 1334.80 horizontal support gold is bouncing upwards today and maybe likes to test ellipse resistance for the last time/last test..., before a stronger down swing into awaited important Labor Day cycle low should start.
I recommend strongly to sell-short gold at possilbe next test of the ellipse resistance. Elllipse is at 1353.70 for Wednesday and at 1351.90 for Thursday! As stop-loss we can place a wonderful tight 2-3$!
Todays high arrived at 1348.80 and somehow I have the feeling that current upswing could reach the ellipse in course of tomorrow... hmm, possible target area for shorts is the 1312-1305 (there we buy with both hands!) till awaited Labor Day low. Give +/- 1 Day.
The identified ellipse acts not only as a magnet for the price. Magnet is also a time magnet. And the magnet influence of the ellipse according time ends officially the day after Labor Day = 09/06. Think now that gold is not able to leave the ellipse trap till Labor Day. Gold should A) consolidate further into Labor Day.
Or option B), it will end current consolidation cycle with a Big Bang = sharp sell off = selling exhaustion. A selling exhaustion shouldn´t surprise us, this happens often in a tight market...
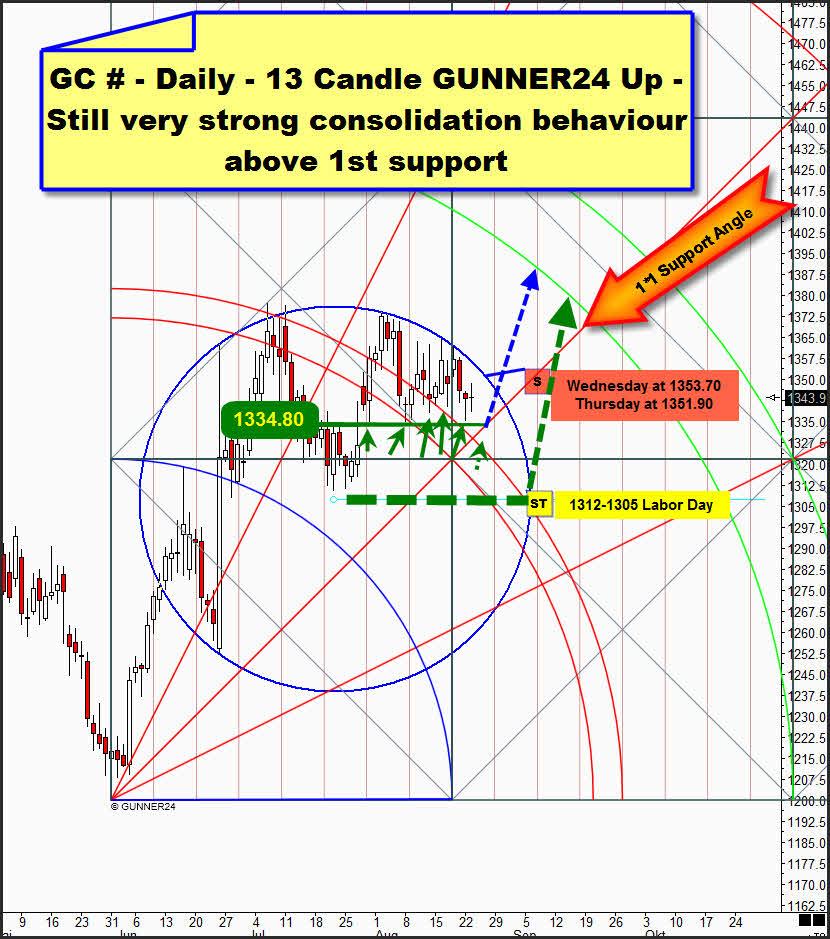
The current cycle still is a strong bullish one. The 1st supports gold since weeks, gold crawls above the 1st enivronment slightly downwards. This is strong behaviour for further up to come.
Cause of multiple proved support of 1st I´m not really sure that gold will test the 1308 combined yearly + monthly GUNNER24 Support early September. So blue arrow scenario is a 40% chance for me. Hmm, gold could surprise and start strong upswing into lower line of 2nd activated uptarget after first test of 1*1 Support Angle without breaking the 1334.80 finally downwards!
Eduard
====================
Based on the George Douglas Taylor Trading Technique that I’ve been studied and originally traded for years transferring it onto the modern markets by constant observation a five day pattern of the single days of the week has resulted.
The crux is not so much that the entire week has to work perfectly. Perhaps it does just at a 50% because the day patterns may shift by one or two days. In the strong upwards trends sometimes you see 4 buy days and only 1 sell day. It’s important to recognize that the day proceeds ideally-typically and to trade accordingly.
My personal trading style has always been the contrary to that of the crowds because the crowds always loose. Especially in gold and silver trading I like to buy the corrections Monday to Wednesday and on Friday if the day patterns correspond with some important GUNNER24 Signals.
I use to go short intraday just on Thursday when the week high is sold off AND provided that the corresponding GUNNER24 Setups signal so covering the shorts when the cycle is resumed.
The ideal five day pattern in an upwards trend – precious metals and US stock market – Do use those patterns for your intraday and swing activities!
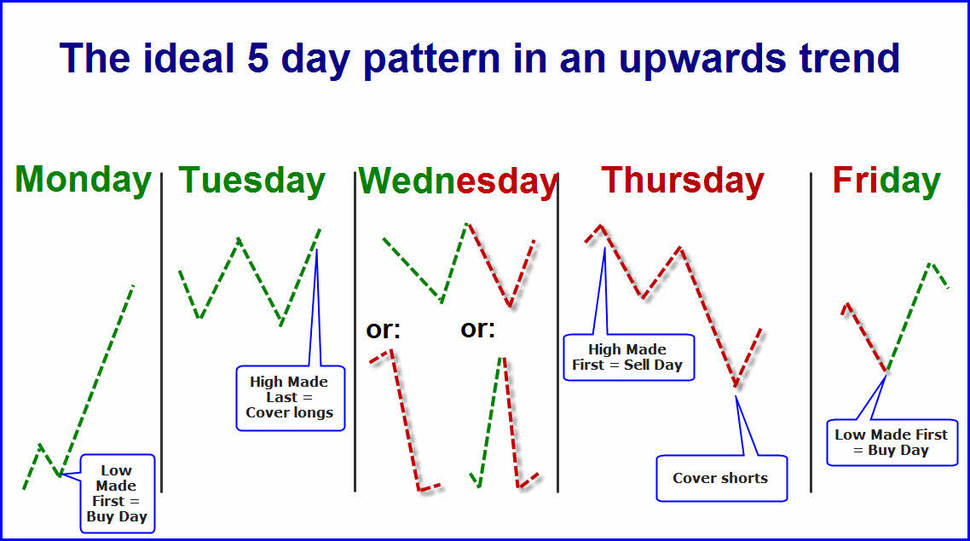
Monday: Buy day. Strong up-day. Low established first. It often ends at the day high. Unthinkingly you may buy all the intraday corrections because the week high comes later in the course of the week.
Tuesday: Buy day. Weaker up-day. A higher high is produced. As early as now the crowds ponder whether the prices mightn’t run too high partially going short already. For me it’s the day when I can cover my Friday and Monday longs. In intraday I try to go long in case of corrections until the Comex opening.
Wednesday: Sell day. Actually the day for covering the longs and for the first short entry. It’s got some different forms. It closes at the same level as it had opened. Frequently at first the high is established because more and more traders short the market. Here the longs fight against the shorts. You recognize that if many teeth, many nicks, many spike candles are to be seen in the chart. On Wednesday I use to do nothing. Only at a 20 to 30% the shorter hearts are pleased because during the whole day there’s only sell-off.
Thursday: The classical sell short day. Because the Wednesdays often close as they had opened the market participants have to cover their shorts because in the beginning the market runs quickly upwards…! And frequently they turn their positions into the high direction being caught on the wrong trail again. Then the market often lays down a beautiful sell-off. In the evening mostly a strong rally follows. That’s where we cover the shorts.
Friday: Classical buy day in the upwards trend. It’s nothing for weak hands. Here’s where you buy the positions near the Thursday lows which you cover again next Tuesday/Wednesday. If you discover that the prices have steadied or even are rising a little bit by closing the five day cycle should continue in the following week.
It’s interesting that we cannot only see those classical pattern considering the whole trading day but also within the classical Comex trading hours 13:20 to 22:15 GMT.
For day trading or scalping respectively here’s the average intraday course from March 2006 to March 2010. Nothing has changed. Many thanks to sharelynx.com!
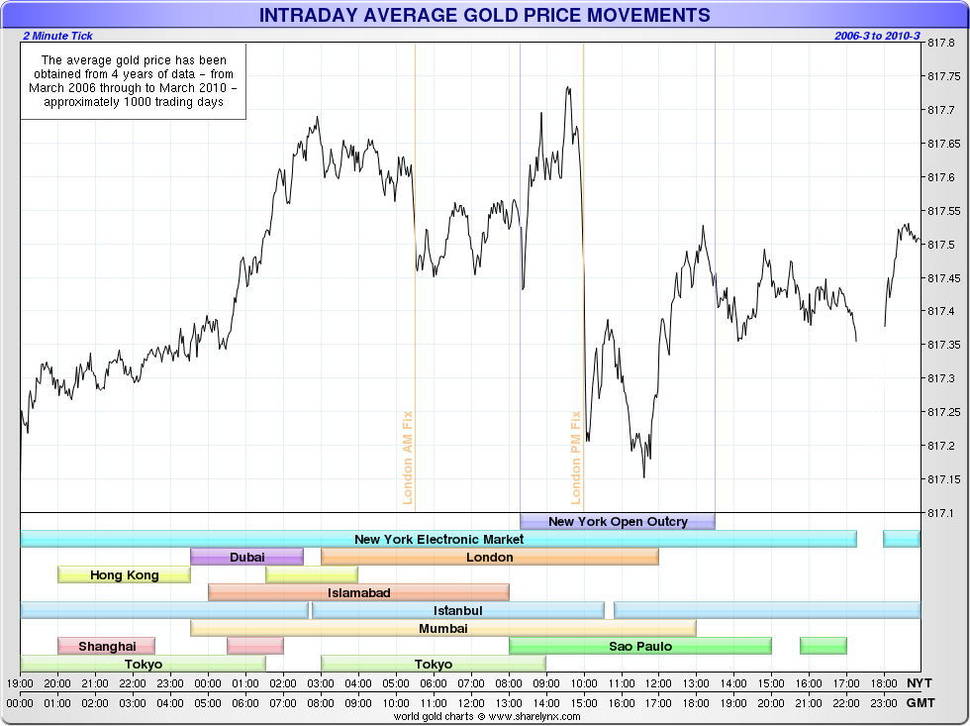
The New York Electronic Market OPENS at 23:00 GMT
The New York Electronic Market CLOSES at 22:15 GMT
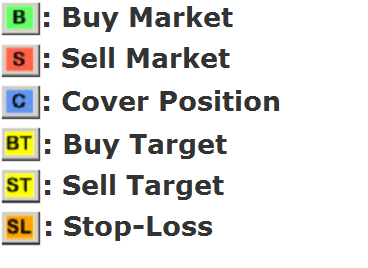
In the charts we work with the following symbols:
========================================
