Please use silver and its nicely confirmed yearly resistance rail now to identify when this precious-metal upcycle will likely end.
There is some evidence today that the current uptrend in the Precious-Metal Sector (gold, silver and the Mining Stocks) is technically not allowed to end before late-January resp. early February 2019!
The time factor is mostly treated quite shabby in trading. There are very few approved techniques that get consistently into the traders’ repertoire. Certainly, the lines, horizontals, pivots, ribbons, channels etc. are steadily being applied in the price chart to derive whether the trend would turn, spin or change.
Yet those items don’t ever give information or certainty on the moment when a trend would finally wish to end. Withal, there are mighty tools to be used almost like a clockwork to recognize when resp. the date from which the trends definitely change or come to an end or when a new trend is supposed to start. Inter alia, we are talking about Fibonacci Arcs and Fans, Astro Lines, Gann Angles and Fans, some different cycle techniques. Of course there are also the GUNNER24 Double Arcs, which often give information about when a trend could or should turn or start to pause ...
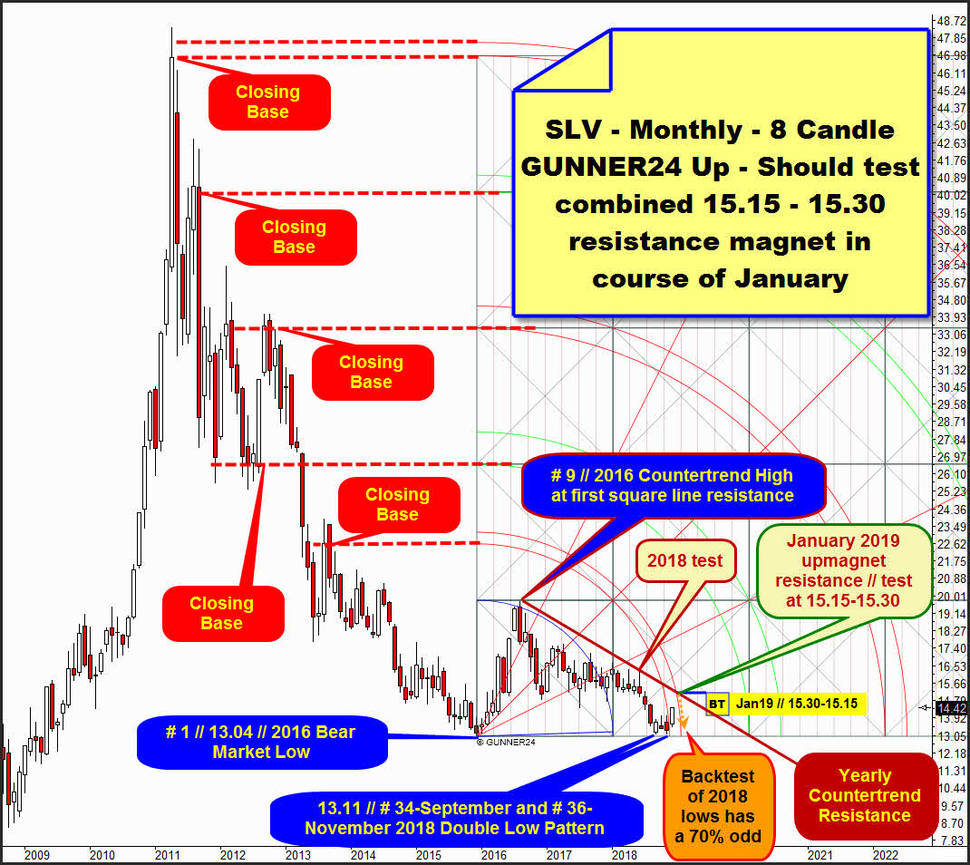
Within monthly SLV ETF candlestick chart below you recognize the valid monthly GUNNER24 Up Setup which overlays the course of silver since its important year 2016 Bear Market Low. Setup is a classic 8 Fib number candle up and reveils that the countertrend, that started at the # 1 // 2016 Bear Market low, made it`s final high after a 9 month candle advance exactly at the natural first square line resistance:
As we know, the past few years have not been very satisfying for precious metal bulls. And I do not think that will change in the next few years. But after all, silver has formed a now quite solid looking double bottom on a yearly basis, which wants to dissolve upwards actually.
The # 1 // year 2016 Bear Market Low is at 13.04 and the two important lows of 2018 have arrived at 13.11. This means that price made small higher low on yearly base at # 34-September and # 36-November 2018 lows and somehow it is already noticeable that the first 13.11 bear extreme of 2018 was printed exactly 34 month candles after the 2016 Bear Market Low.
As you know, 34 is a very high, correspondingly important Fib number and possible trend turn date, thus according to our rules the monthly trend might have turned from down to up at # 34 // 13.11 // September 2018 Low.
This month candle development is most bullish candle for silver since over a 1 year and one of the best up months for 2 years and this indirectly confirms and strongly supports the likely monthly trend change! And although this probable underway monthly bull trend or upcycle may have started only after the successful backtest of the 13.11 support and thus cemented 2018 Double Low of # 36-November 2018!
The new monthly upcycle started really well in terms of the price but only with the December open. Because at this time event, something was skipped that prevented SLV from rising. Notably the lower line of 1st double arc above in the monthly chart, I strongly suppose. This very likely important arc resistance skip at the December 2018 opening action is also well visible in the daily SLV chart below ...
Ok. If the lower line of a double arc within an up setup was important for the market or price - and therefore is confirmed as important - then in most cases also the upper line of this double arc will be future important for the market (a turn/a price extreme/a trend continuation trigger). And that`s why I expect SLV to test that upper line of 1st - usually stronger upmagnet resistance - in further course of this newly started monthly upcycle.
And actually this should now be an important upward magnet that should be worked off in the course of the coming month January 2019, since then and there at 15.15 to 15.30 the confirmed important (pinpoint negative backtest at noted year 2018 lower monthly high) declining dark-red Yearly Countertrend Resistance runs and thus forms a very interesting future upcycle magnet with the activated upper line of 1st double arc upmagnet/uptarget.
==> Strong monthly upmagnet resistance at 15.15 to 15.30 exists for entire January 2019!
Cause January 2019/15.15-15.30 resistance upmagnet represents a resistance upmagnet on yearly base the current underway uptrend is expected to end about there and about then. And actually, after the achievement resp. work off of this magnet, silver would sooner or later have to re-test the 2018 Double Low bottom in the course of spring. This scenario has a probability of about 70%.
On the other hand: if the SLV ETF succeeds in closing either at the January and or the February close above 15.60, thus fairly above upper line of 1st double arc, then the Silver ETF should be able to test the 19$ surroundings in the further course of the coming year!
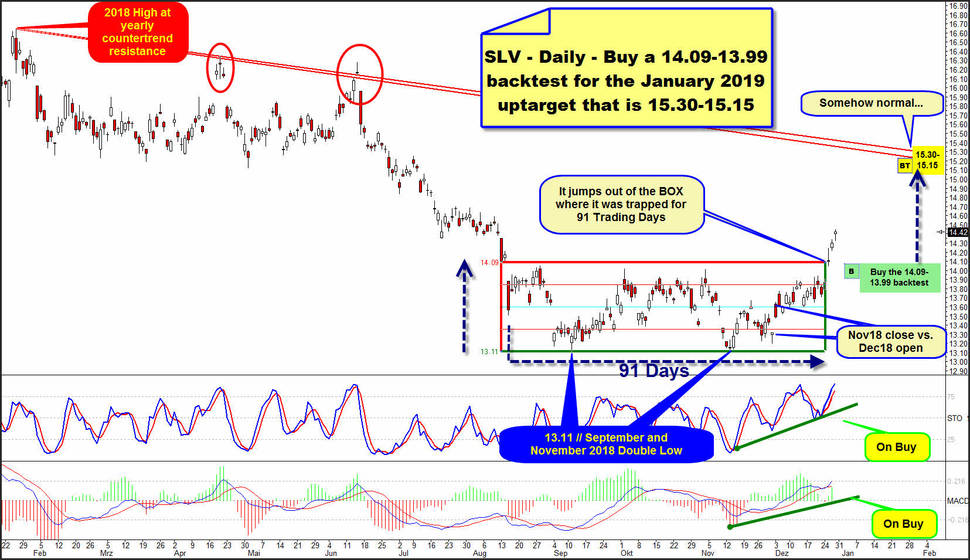
Below follows the announced daily chart. We see that the SLV ETF is leaving its 91-day fairly narrow trading range upwards. The monthly opening gap, which is torn by the 13.63 December 2018 opening auction, I have noted:
Over the Xmas holidays, the price jumped over the BOX in which he spent 91 Trading Days. This BOX price range is 14.09 down to 13.11, the occured 2018 monthly Double Low.
See, that until the very last trading day of November the price went just sideways. Then on time at open of the new month a monthly, even a resistance on yearly base was skipped and the December 2018 open triggered the likely new monthly but for sure daily and weekly upcycle which on Wednesday for the first time closed above (14.11) the red BOX resistance horizontal. Until week-end SLV ETF remained bullish.
I find it in terms of time or in terms of an important turn again very noticeable that the SLV stayed a total of 91 Trading Days in the BOX before it went above ==> this last important daily sideways cycle or bottoming cycle was therefore probably oriented to the 89 Fib number...
This one is on go now for the next backtest of the falling Yearly Countertrend Resistance line, I suppose!:
Daily momentum is strong bullish up today, without radiating disturbing signals. Momentum and price together make higher highs and higher lows. The classic uptrend pattern! This is a strong, and clean daily and weekly uptrend! That's why the final overcoming of the BOX resistance should succeed and thus the next higher important resistance upmagnet should be tested in further course and next.
Also daily chart offers the imminent test of the falling Yearly Countertrend Resistance at 15.30 to 15.15 area in course of January 2019!
==> We should buy a backtest of currently most important supports. The 14.09 BOX line, prior resistance usually is now first strong daily support and interesting future downmagnet. Next lower daily and weekly support is the "round" 14$ number.
The 14.09-13.99 test/re-visit would be just classic uptrend backtesting behavior and could happen within days as more and more traders have finished their holidays!
==> Shortterm GUNNER24 Uptarget is the next, probably again very negative backtest, of the Yearly Countertrend Resistance at 15.15 to 15.30 towards end of January 2019.
I wish you and your families a Happy New Year!
Be prepared!
Eduard Altmann


