Going with the pre-Christmas time the precious metals presented themselves very contemplatively. On daily basis almost nothing happened last week. Some strong resistances continued dominating. They prevented a further rise, having the gold go on consolidating.
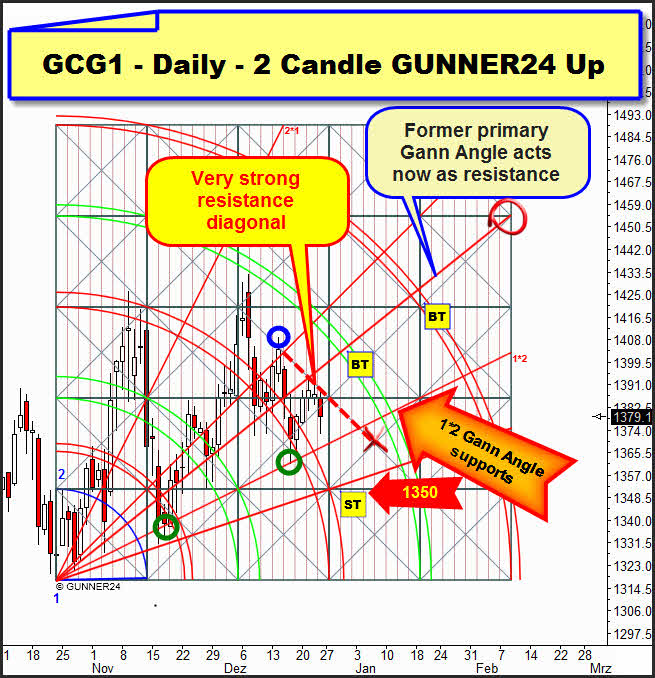
In the actual daily 2 Candle GUNNER24 Up a new resistance diagonal crystallized (in the chart it’s anchored in the red X, red dotted). That’s where the last three trading days marked their respective highs. Besides, within three weeks gold did not once succeed in closing above that resistance diagonal!! As prognosticated in the last issue the former primary Gann Angle is now acting as a resistance. The Tuesday high was marked exactly at a price and time magnet - at the intersection point of the former primary Gann Angle and precisely that relatively strong resistance diagonal.
Our trading plan for next week: We’ll use a day closing price higher than the resistance diagonal for a long entry with target 1420 until the end of January.
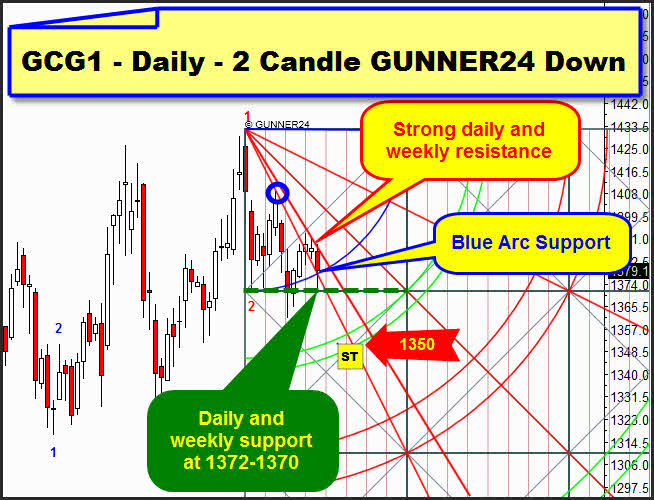
Just like we did last week we’ll briefly enter into the daily 2 Candle GUNNER24 Down which gives us a different angle to the current correction at present:
The down setup exists parallel to the current up setup. Both alternate in terms of their dominance. The signs of both have the same power. The up setup makes clear the targets in price and time according to the upwards forces which are present in the market. The down setup reveals the dominating downwards forces of the market.
Here we make out that the highs of the last three days were marked at a Gann Angle. That’s what both setups have in common. This Gann Angle is preventing the further gold rise pushing the price downwards. On Thursday gold closed narrowly above the blue arc that offers support.
Now we must have the market guide us. Maybe the downwards forces will gain the upper hand being broken next week that blue arc together with the lower line of the first square. Target would be the 1350 in that case. We’d go long there (pay attention to the reversal candle technique!) since from the GUNNER24 View the maximum correction target would have been reached:
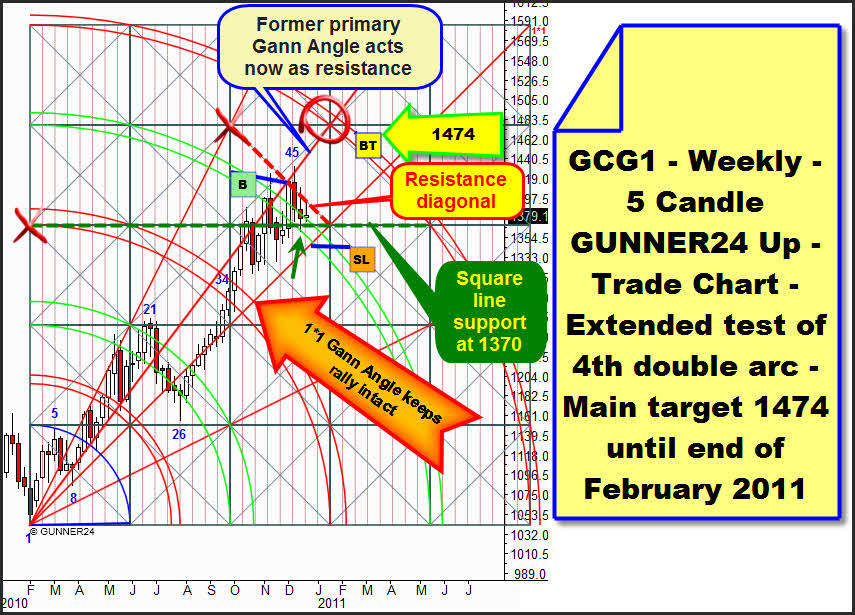
In the weekly setup the same dissension is showing as in both daily setups. A weekly resistance diagonal (anchored with the red X) is corresponding with both daily resistances. The daily support at 1372-1370 is corresponding with the weekly square line support at 1370.
Furthermore we make out that it’s unequivocally a normal correction in the upwards trend. The 4th double arc was definitely broken four weeks ago, now it’s obviously tested. It’s producing clear support. You’ve got to come to that conclusion after analyzing the lows and the closes of the last three candles: The lows are dipping between the lines of the 4th double arc, the closes are rather lying at the upper line of the 4th double arc, not any significant closing price is achieved, either within and much less below the 4th double arc. That intense test of the 4th double arc allows the price to dive down until 1350-1345, all the same.
That’s where the mighty, unbreakable 1*1 Gann Angle is going to produce support. Therefore the 1350 would be the greatest belated Christmas present the market makers could give us…1474 continues being the target until the end of February, 2011.
|
„As far as I know", the GUNNER24 Forecasting Method is the globally unique and only technical analysis tool that deals intensely with the comportment of the market at support and resistance marks being able to combine that with price predictions. You’ll learn everything on these really "secret" facts in the Complete GUNNER24 Forecasting and Trading Course. Order now!
New long engagements in the S&P 500:
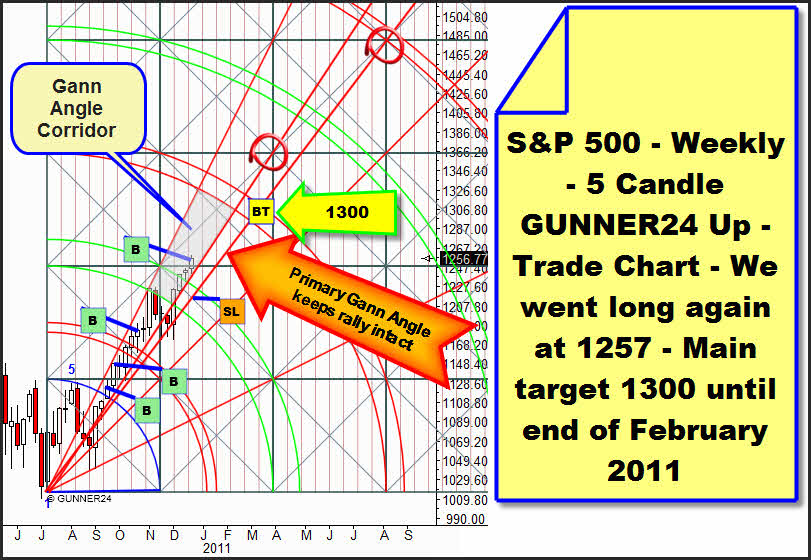
On daily basis our buy stop on December 20 worked. By day closing we went long at 1247. Now, we’re expecting the high of the current upswing to happen in the first week of January. We’ll cover there at 1267. Here you may read up the complete analysis on that entry and the planned exit.
Weekly situation:
At the week closing we’ll accumulate another long position. Now, the 2nd double arc is broken significantly, even though we consider the lost motion. Very clearly we can see the market moving upwards in its Gann Angle corridor. Target 1300.
NASDAQ-100:
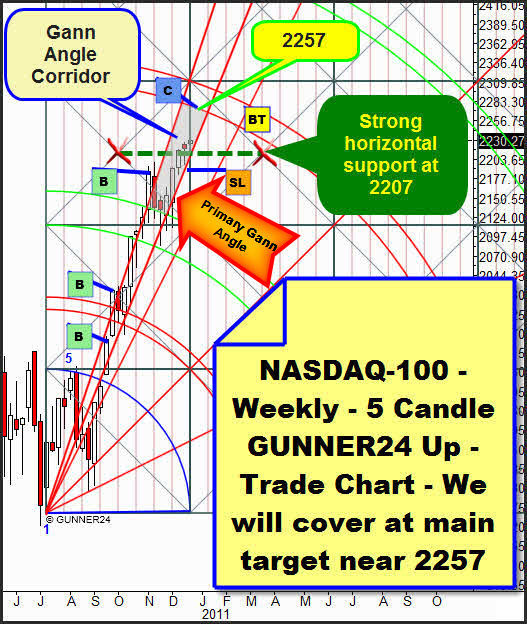
The situation: The actual weekly 5 Candle GUNNER24 Up Setup is showing us that the 2257 we had aimed for are within easy reach. In its Gann Angle corridor the market is running straightly upwards. Another profitable short term long entry for swing traders is possible next week at the expected low by the primary Gann Angle at about 2222.
The low of last week which rebounded from the setup-anchored green dotted support horizontal shows us this: That successful test should really have produced plenty of rebound energy to call quickly for the 3rd double arc.
Reaching the main target (the 3rd double arc) should coincide with the 1267 in the S&P 500. At 2257, the lower line of the 3rd double arc, we’ll cover all our weekly long positions as well as our daily long positions (Please pay attention to the GUNNER24 Forecasts of 12/19/2010 about that).
A correction lasting about eight to thirteen days should start off at those 1267 in the S&P 500 and the 2257 respectively. At the end of the correction we’ll look for another long entry on daily basis.
Be prepared!
Eduard Altmann

