How devastating and brutal a downtrend happens to be – again and again it’s astonishing for me being a chartist who because of natural fate may deal with supports and resistances to derive from them signals and future targets and changes in trend. When it comes to gold, during the last 3 trading days that much chart-technical blood was left on the carpet. So I might present many pictures, attached to meter-long analysis to demonstrate the longterm consequences of the 1220 being broken in gold. But I won’t today. I don’t feel at all like doing. Instead, I rather try to nail the very near gold-low of this downswing today.
Therefore just very briefly: From this low that is technically due for next week, gold is supposed to go up in a several week countertrend (6-8 weeks) to at least 1320 before the final low of the whole correction in the monthly time frame will be on the agenda for the middle of 2014.
So let’s get started nailing.
We know that the 1222-1220 is an extremely important Gann Magnet. Read up here please… At 1222-1220, in the month of December 2013 altogether 3 monthly GUNNER24 Supports meet in one price. On Wednesday gold closed below 1220 at 1218. Bang! The avalanche was unleashed. Particularly bad – and with enormous significance for the further course of gold and for almost assured additional lower lows on monthly base – is the fact that the 1*2 Gann Angle Support starting from the bear-market low of the year 1999 is fallen below now. Even if December achieves to close once again above 1220, now this most important yearly Gann Support is softened thus being tested intensely several times at least. A monthly close below 1220 in December 2013 will mean future new lower lows on monthly base at 1200%.
Thursday didn’t waste too much time on the next lower monthly Gann Magnet cluster = normally a super strong support. Between 1206 and 1198 there is a monthly GUNNER24 Support Nest. Bang! Close was at 1187. Friday closed near the 1203 thus not having been able to re-conquer this support nest on weekly close. Gold managed to produce a weekly sell signal indicating some new year-lows for next week. Within the last 3 days, Wednesday through Friday, that much went to pot, so words fail me. I dare to think that in chart-technical terms only the break of the 1522 was awful in a similar way.
Where is gold supposed to go now to swing finally and definitely into the countertrend?
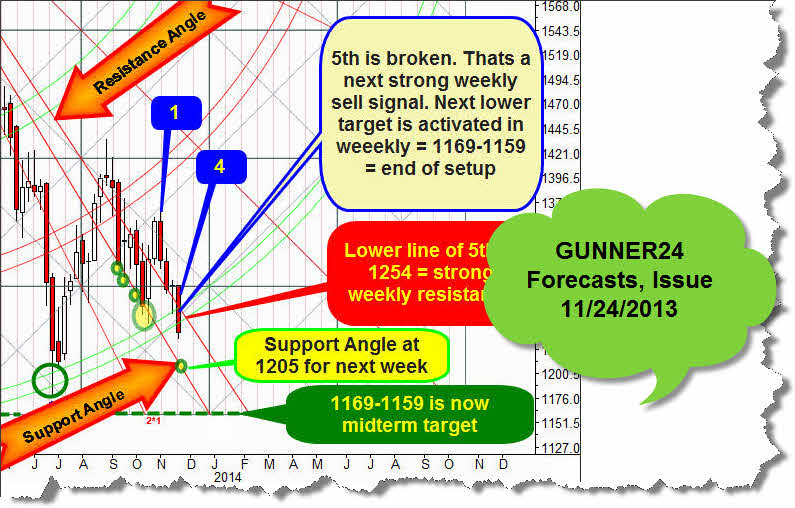
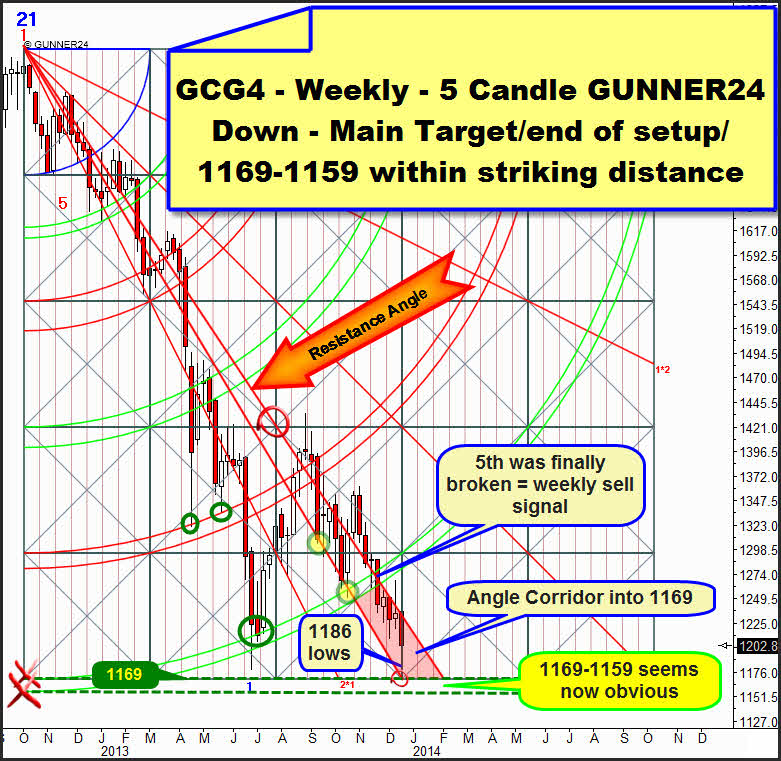
It’s 1169 to 1159. The solution is given by the ruling weekly 5 candle down. This target was most officially activated in the weekly time frame at the end of November. Then gold broke through the support of the 5th double arc activating the end of this setup in terms of price as the next main target:
With gold, it seems to be like it used to the last years: The weekly time frame with its signals and targets is overruling the monthly time frame. May the monthly time frame put out one time frame support after another - the weekly chart with the magnetic power of its targets is dominating after all. This is how it seems to be in hindsight.
…Since the break of the 5th double arc 5 weeks ago gold has been trading downwards in a corridor. From above the Resistance Angle anchored in the center of the setup is pressing on the price. A weekly high and a weekly opening are situated exactly on this angle.
Long-signal: In spite of a strong rally attempt the week before last was forced back into the corridor. That’s an indication that going long on weekly base is "most officially" only allowed in case gold closes above the Resistance Angle.
Main target or the possible low of this downtrend respectively: The price end of this setup is exactly at 1169. The horizontal support that started from the intersection point of the lower line of the 5th is at 1159. Exactly at one of both horizontal supports but also at the 1172 (next lower monthly horizontal support), close to the 1169, there is a possible price for the low we expect now.
The exact derivation of the 1172 is to be found here.
Moment for this low: The extremes at the commodities love to orient themselves by an important Gann Seasonality, in terms of time. Winter solstice is the keyword. 12/21 is a Saturday this year. Around these Gann turning points important changes are to be expected. I think since the middle of the year, cyclically gold has been orienting itself exactly by the course from mid-2011 to mid-2012.
Then, a significant low succeeded on 12/29/11. From this moment a countertrend rally started, topping out at the end of February 2012. Before, on 07/01/2011 the significant traditional summer low was brought in (summer low 2013 on 06/28). From there gold went to the all-time high of 09/06/2011 (the last important gold high of 2013 was made on 08/28).
The divergence to silver is one of the reasons why gold may/should make its low next week, significantly turning up afterwards. For the panic in the gold market didn’t impress silver much.
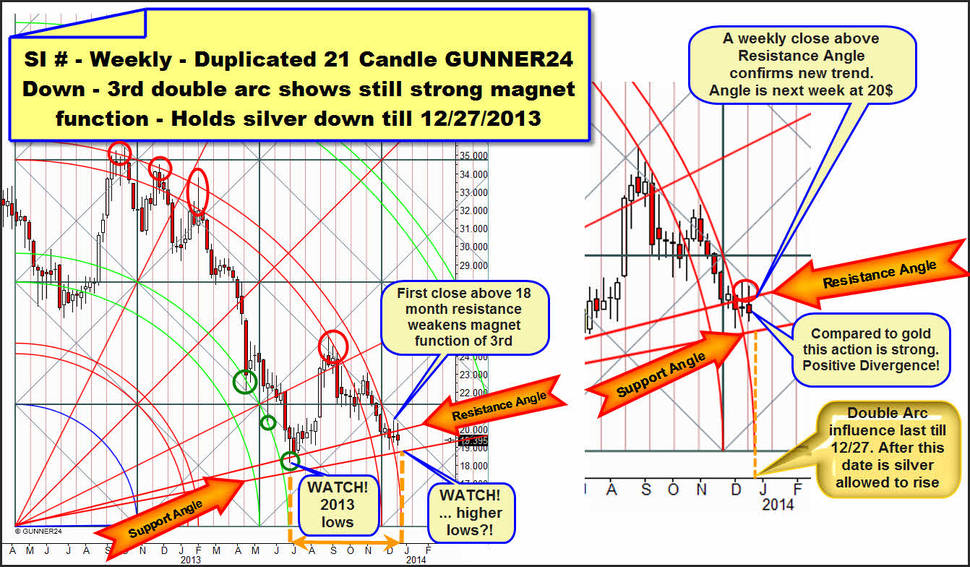
I almost believe that silver produced its correction low four weeks ago at 18.89. But it mustn’t rise yet significantly either. As early as a couple of weeks ago I supposed so, in fact I did because of the lasting magnet function that the main resistance of the 3rd double arc in the duplicated 21 candle up in the weekly time frame keeps on exerting:
Even though silver has been trading above the 3rd double arc in the weekly time frame for the second trading week, it cannot move away upwards. The "gravity" of the 3rd double arc won’t expire before next week. Then the upper line of the 3rd will intersect the time axis:
On the left in the chart you see the entire weekly setup. You may read up here how and why we can apply this setup. To the right side I put a chart-amplification. The upper line of the 3rd keeps its magnetic effect till 12/27. The next trading day after 12/27 will be 12/30. I depicted the times when the upper lines of a double arc intersect the time axis by the dotted orange verticals.
As you can see on the left the gravity of the 2nd double arc (depicted green) led to the current year-low at the end of June 2013. Not before the magnet function of the 2nd was finished, not before the upper line of the 2nd intersected the time line, silver was allowed to start rising. Now I expect the same performance to happen again at the upper line of the 3rd.
If silver maintains its positive divergence to gold next week – I work on this assumption – in the very worst case a new test of the Support Angle might occur. This angle is at 18.80$ for next week. That would mean still a little lower low than the one on 12/04. The low of 12/04 is at 18.89$. But technically silver shouldn’t reach more than 19$ if gold trades at 1172-1169. If gold wants to see the 1159 silver will be likely to head for the 18.89-18.70 at the support angle.
Conclusion: The year-low 2013 in silver was reached on 06/28 at 18.17. It appears technically impossible that silver may reach new year-lows till the end of 2013… contrary to gold where many things are pointing to a new year-low for the coming week. Silver is also indicating that the lows of its last downswing are brought in already. Silver is showing a clearly positive divergence, such as it uses to whenever both metals face a common rally. Everything suggests this soon up-turn! We will see important lows in gold next week I suppose. The lows will be between 1172 and 1159 and a subsequent countertrend rally till February 2014 with first target 1320.
This forecast will be confirmed when the first weekly buy signals are put out by the weekly charts. That takes weekly closings above both important Resistance Angles in the weekly time frame.
In these whipsaw markets of the last weeks that might confuse any trader thus leading mercilessly to burning the trading account the professional signals have got their special importance. You get them in the GUNNER24 Gold Trader!
You best register with our GUNNER24 Gold Trader now. That’s where we oversee the optimal entries and exits for you. Especially in the difficult market situations where many factors have to be considered the Gold Trader is backed by the additional GUNNER24 Signals based on the combined 1, 4 and 8 hour setups to catch the optimum entries and exits.
The GUNNER24 Gold Trader will provide you with the critical knowledge you need to forecast and analyse the precious metals with the GUNNER24 Forecasting Method. All the GUNNER24 Trading Signals you receive real-time are based on the actual Gold and Silver Future. The NEW GUNNER24 Gold Trader is a must for every actively working investor and trader who wants to trade successfully in everyday trading. The insights you receive from the head trader Eduard Altmann (and discoverer of the GUNNER24 Forecasting Method) are truly amazing sometimes. I promise!
Click the button below and order the GUNNER24 Gold Trader - $39.90 US a month. For 201 members and up - $49.90 US a month.
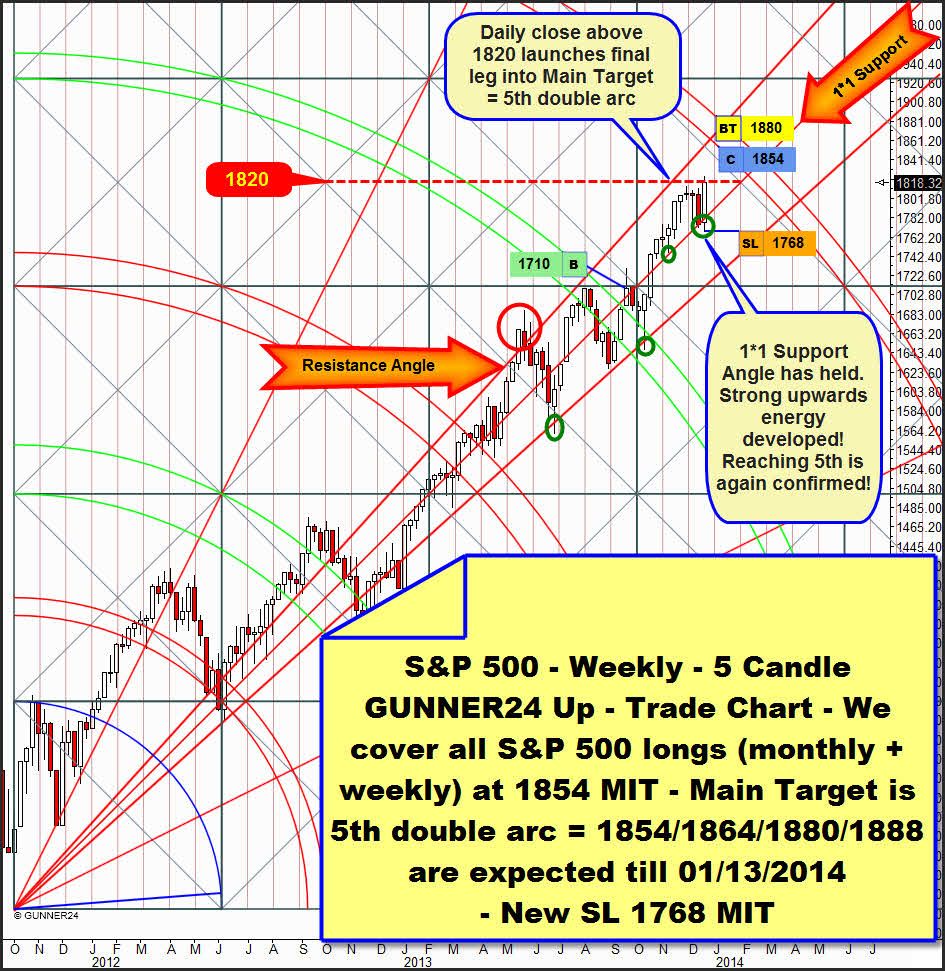
As presumed last Sunday the starting signal into one of the most likely exhaustion targets of this bull-run was triggered the past week. From the support of the 1*1 Gann Angle there was a hefty price explosion up to the next higher weekly resistance at 1820. The center of the currently passed square is there, a natural resistance.
The 1820 are and were an important trigger mark. For a couple of weeks I have been pleading for the thesis that it will take a weekly close above 1820 to signal the final leg into one of the exhaustion targets. But because of the time narrowness now I think that a daily close above the 1820 would be enough to activate one of the exhaustion targets.
By virtue of the analysis of 11/17/2013 for the S&P 500 we expect either an exhaustion in January 2014 up to both monthly exhaustion targets 1854 and 1864 or a January top at 1880 if the weekly time frame wants to fulfill its target. The daily time frame puts out a main target of even 1888. The moment for the end of the exhaustion is January 4 to 13.
Now we’ll have to concentrate on covering the present long-positions. In the following days of traditionally weak volume the markets may easily be manipulated into one direction or the other. Mostly in times of holidays the previous trend is continued. Without defense of the bears that prefer sitting with their X-mas feast rather than behind the trading desk, quick peaks are possible. Likewise we’ll have to reckon with extremes if the dominating trend wants/has to exhaust in the holidays.
I think I remember having once read in a trading book that the pit traders in New York and Chicago make about a 50% of their profits of a calendar year in December. In this month the manipulation of prices from the pits is easiest, just due to the really low volume during the X-mas time until the years have changed.
For my taste, the S&P 500 has taken too much time to reach the 1820. That’s why somehow the 1880 or the 1888 seem to be too far away for the exhaustion top. So we rather take care covering at the lowest exhaustion target. Otherwise the 1854 is a monthly target being easily able to overrule the lower time frames. Just +2% is the distance left between 1854 and 1820! Just one day of distance as I use to say…
But exhaustion always means extreme exaggeration as well. If the 1820-dyke breaks, the 1880 will be loose, too. And it becomes rapidly possible. But those are moves that technically only take the confirmation by daily and intraday trading signals.
We cover our weekly and monthly S&P 500 long-positions at 1854 MIT (market if touched). We place the SL for the weekly position to 1768 MIT again, and we rise the monthly SL from 1758 to 1768, the lows of last week. If this low is fallen short again before one of the exhaustion targets is reached, something will have to be wrong with the forecast or the 1820 weekly resistance turns out to be as a hefty resistance. But currently we don’t have to work on such an assumption.
As analyzed, the NASDAQ-100 main target remains at 3550. As notified on 12/08 we cover there our monthly long-position we went in on 10/31/2013 at 3377 MIT. As last analyzed on 12/01/2013 we still expect the NASDAQ-100 top to occur in the first trading week of 2014.
Be prepared!
Eduard Altmann


