Rally attempt: the third – Dear NASDAQ help us, please!
Time is near for gifts and prayers. Because, o Lord, answer us. Give us some hustle and bustle again! Another uneventful week went by in spite of the quadruple option expiration week.
Yet the American indexes are staying on course. But they've got tremendous problems to clear the monthly resistances like the 3rd double arc here in the case of NASDAQ-100.
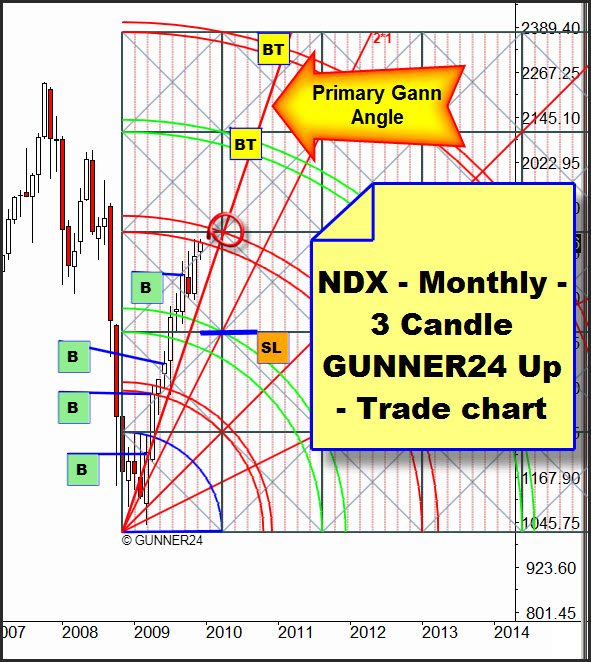
It's very nice to realize that the price is not shying away from attacking the main target. It is not spiking away from it but getting it lined up in its sight slowly but surely. If December closes within the 3rd double arc we will be working on the assumption that we shall reach the next, the 4th double arc which would be a nice Christmas gift for all of us, wouldn't it?
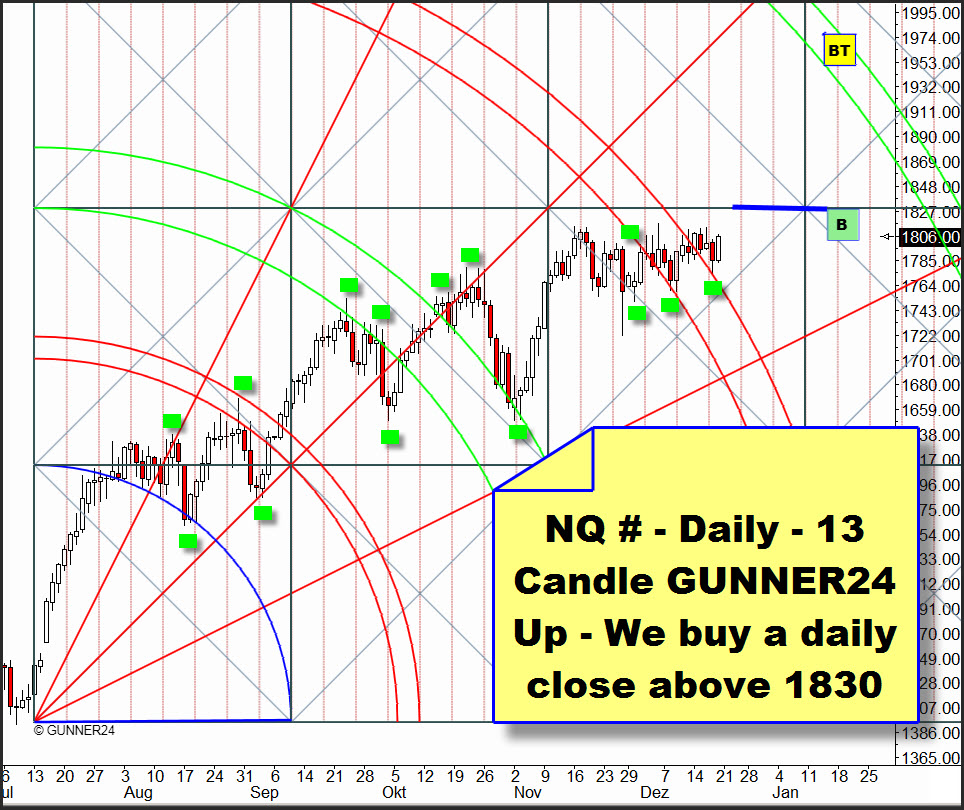
In the Daily 13 Candle GUNNER24 Up Setup, on Friday the price definitely overcame the 3rd double arc after having tested it on Thursday successfully. Thus, the way is paved for furthermore rising prices and there are signs of rising prices at least until the middle of January, 2010.
Again, the expiration week had a great effect on the gold price. That "forcing down" the gold price up to the expiration day, has been a notorious pattern over the last years which worked in nine cases out of ten. It is to be taken into consideration while trading gold. It's true we did not turn the future shorts on daily basis at 1100 which had come in at 1220 two weeks ago, but we covered them.
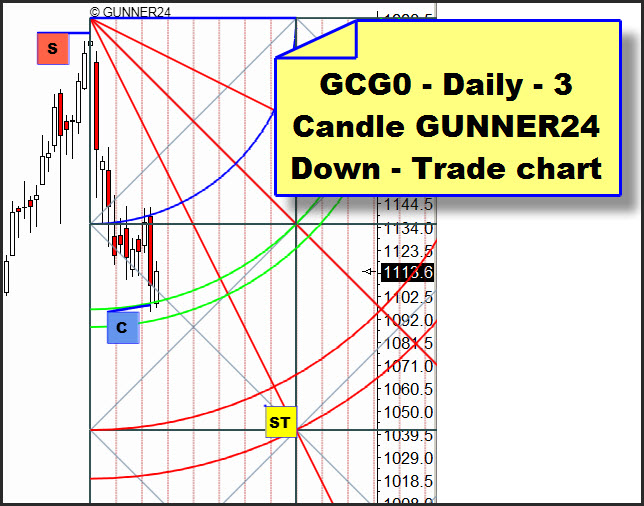
In the Daily 3 Candle GUNNER24 Down, the situation is looking as follows: We broke the first square and tested it back on Wednesday and Thursday. We covered the shorts with the Thursday evening spike that touched down on the first green double arc because gold is in a strong upwards trend and according to the rules, in case of a correction at the first or second double arc we can expect a change in trend. Since the first short target was reached accordingly we will have to wait for an opportunity of getting in long.
Seen from the seasonal angle, through the middle of January gold will have to pass through a debility phase which not necessarily results in heavy losses within the next three weeks. I rather expect a sidewards move with a trend to short. The possibly lowest sell target in the daily GUNNER24 Down Setup is the 2nd double arc with target at 1075-1080.
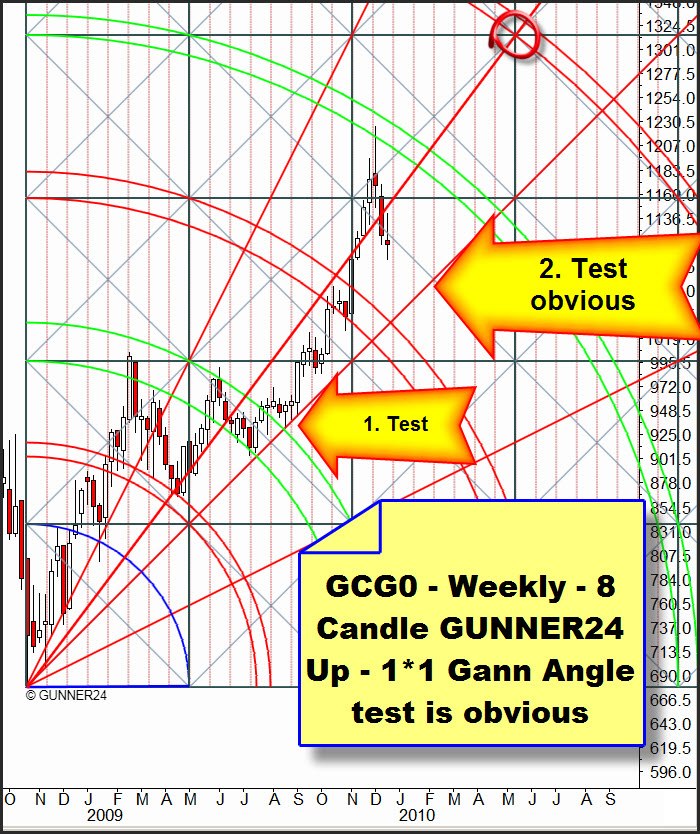
This daily target is also corresponding with the probable test of the 1*1 Gann Angles in the upper Weekly GUNNER24 Up Setup and with the horizontal square line in the monthly GUNNER24 Up Setup being at 1075 and providing the gold a monster support.
On monthly basis, at 1120 with a little position we went long with GLD since the buying zone on monthly basis is between 1100 and 1127. Thus, "beyond the rules" we increased our longs and at 1075 we will do it again.
In case of the EUR/USD, at 1.4430 we were stopped out completely with the weekly longs. As we always work with the reverse and double technique our position there turned automatically from long to short with double position size. On Friday, we covered the shorts at 1.43 having closed the positions which had been under way since March, 2009 with a profit of almost a 40 %.
Even though with the EUR/USD last week all the important supports and Gann Angles on daily and weekly basis were broken the GUNNER24 on monthly basis goes on saying "long".
Yeah, in spite of the impressive Dollar rally the EUR/USD pair is clearly in an upwards trend.
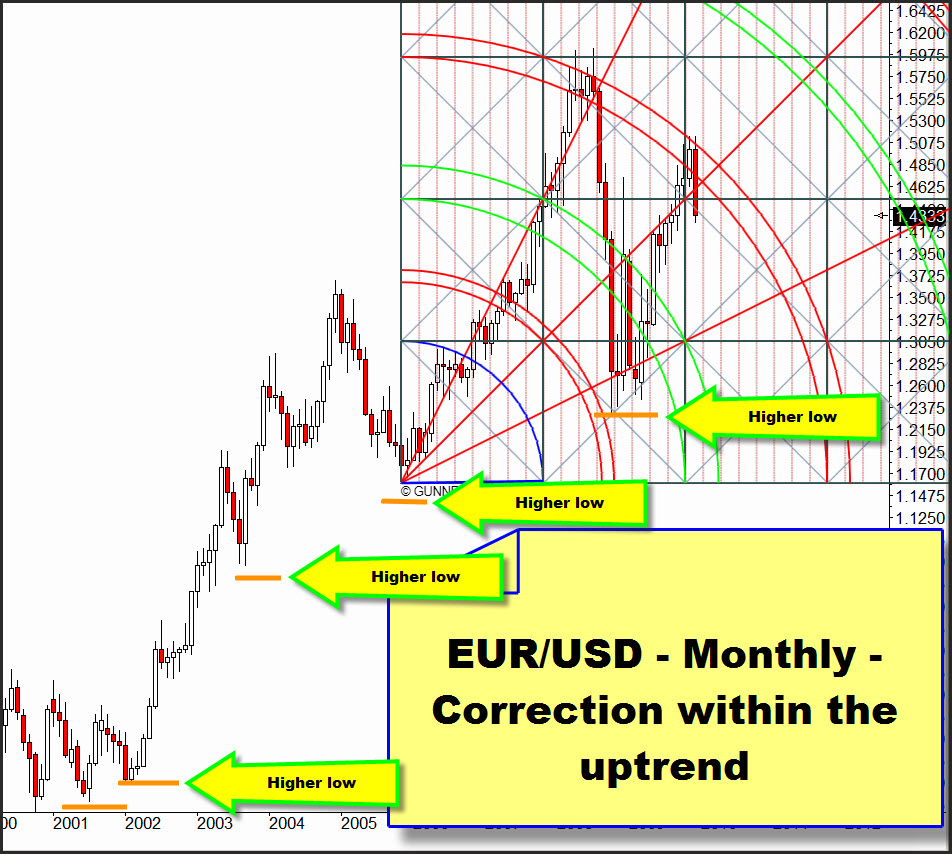
The correction which is actually taking place should result in a 6th higher low within the upwards trend that has been dominating since 2000. With the December candle, the actual correction will produce a reversal candle switching the intermediate trend from long to short. Particularly as the 1*1 Gann Angle is going to be broken. We should look at the actually valid Monthly GUNNER24 Up Setup in order to judge the depth of the correction.
Just to begin with a general indication on the validity and importance of the GUNNER24 Setups considering the course of time. Strictly speaking, the last, actual Setup is always the most important because it is provided with the actually strongest energy level. That energy level is always formed by the last initial impulse because that's where the market participants not only fix the future price direction but also determine the expansion of the move in price and time. All the same, the older initial impulses naturally influence the actual price and fix it especially if in older GUNNER24 Setups just like in the chart above price and time meet for instance at a main target.
Here is the actually valid monthly initial impulse of the EUR/USD:
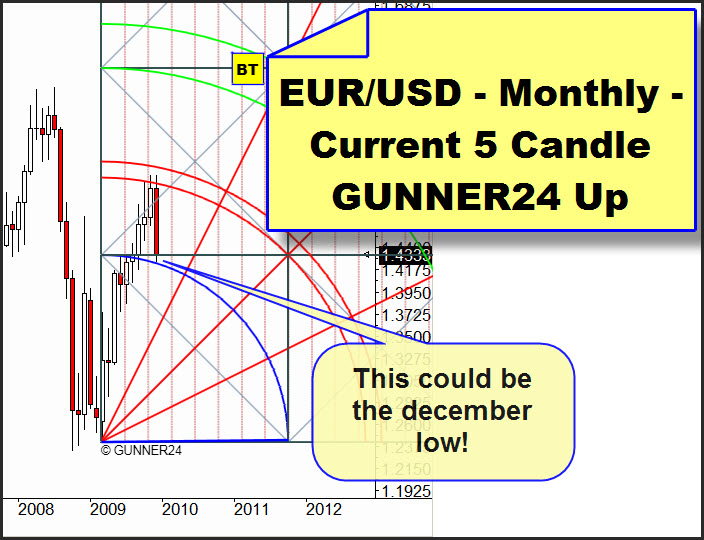
The situation: The price rebounded undoubtedly from the first double arc, testing back now the blue arc. From my view, the setup shows a mixed image. At first the intense rebound from the first double arc is to be assessed very negatively. Above all, the price has not closed within the first double arc. On the other hand, the test of the blue arc is an indication of rising prices next week. And it means through the end of the year, for the time being rising prices on daily basis can be expected. On monthly basis, I decide to wait and see what happens to the pair. Neither short nor long.
Be prepared!
Eduard Altmann
