At very short notice, the precious-metal sector is supposed to remain confusing and uncomfortable till year-end, maybe through the first trading week 2017, yet the extremely favorable chances are clearly at the upside now. On the present levels, no short-engagement should be effected anymore! No acceptable risk-reward ratio is existent any longer!! Start to collect the hard beaten Gold and Silver Miners resp. the customary suspects = leaders in that area next week.
Then, with a bit of luck a whooping 100% up-performance shall succeed in being attained within 2-3 months, I think…
I’m already giving this important alarm of entry into the Gold and Silver Miners for a normally rather sharp price rise lasting probably 2-3 months even though "we" haven’t got the final confirmation of a trend change, for today’s issue is going to be the last one in 2016, and the next GUNNER24 Forecasts won’t be issued before 01/08/2017, since the coming two Sundays will fall on holidays.
HUI Analysis (NYSE Arca Gold BUGS INDEX) with the aid of the weekly time frame.
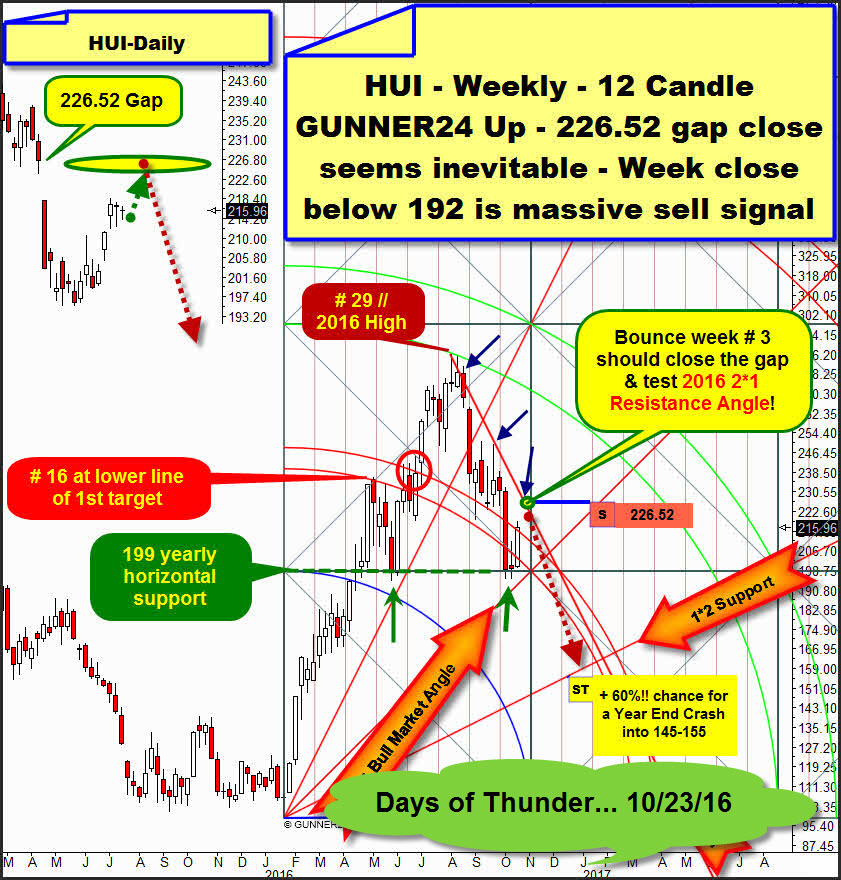
The so far last Gold Miners consideration in the public area ensued within the 10/23/2016 "Days of Thunder" forecasts. Then, it was obvious, that the HUI is aiming at the backtest of the important 226.52 gap = up-magnet most rapidly before from there the next intensive and relentless multi-week downtrend wave into the year-end will start:
It starts at the January 2016 bear low measuring 12! (close enough to the Fib number 13) first initial up impulse. This initial up impulse measurement nails the important cycle high of the 2016 bull market week # 16 at the lower line of the 1st double arc uptarget as well as the final high of the year (high of bull market week # 29) at the lower line of the 2nd double arc uptarget.
==> The HUI was expected to close its 226.52 gap then selling off - with a 60% of probability and driven by the downwards influence of the 1st double arc magnet down to the important and strong 1*2 Support Angle, indeed until the year-end. Correspondingly, 145-155 pts was!/is? possible sell-off target according price.
I slightly adjusted the dominating weekly 12 Candle up in respect of scaling the price-and-time axis, so we’ll be able to keep on working better in terms of signal-safety:
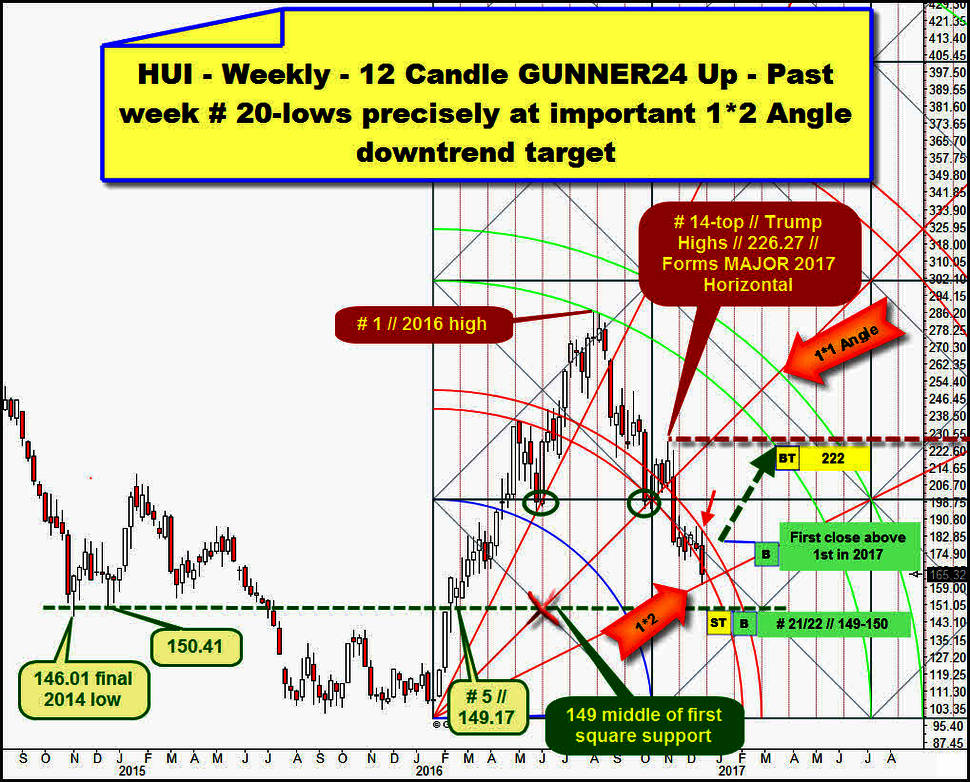
The HUI within the setup is up-dated now. Friday close was at 165.32 pts. The sell-off low is at 160.25 pts, thereby already very close to the initial year-end-crash-target area of 145-155. On Thursday, the day after the announced FOMC rate hike decision the 160.25 sell-off low was marked. Last week was the 20th, next will be the 21st! week of the downtrend.
I begin the analysis and the forecast at the red # 1, high of the year, triggered by the lower line of the 2nd double arc – the indeed most important and strongest future resistance for coming 2017!
The downtrend that started at the final 2016 high fell at first into the area depicted by the green support circle. That’s where a first important downtrend low was reached. In the green circle – simultaneously and with the same price – the 1*1 Angle, the first square line and the lower line of the 1st magnet ware situated. That’s when and where these three supports formed a triple GUNNER24 Support Magnet. This triple support magnet was able to trigger a pretty weak 4 week bounce.
The bounce ended at the top of the 14th week of the downtrend. At 226.27 pts. I just call it the Trump high. An important countertrend high not only for the Gold and Silver Miners, but also the gold and silver futures market spiked indeed – ongoing negatively – into their respective Trump highs still attained in the election night, shortly after becoming clear that Mr. Trump will be the future US President.
For the time being, the Trump highs in gold, silver and at the Gold and Silver Miners & HUI etc. are now the very most important and very strongest newly formed horizontal resistances for the coming years. Thereby, at the HUI the mightiest newly formed horizontal resistance for 2017 and the following years is situated at 226.27 pts. Because: 14-1 = 13 is Fib number.
Thus, the downtrend count is signaling that the Trump high will be extremely important for the future. Not before the HUI will trade above its Trump high we’ll have an 100% confirmation about the HUI to be in the bull mode again!/newly?
==> This is effective thereby: As long as the HUI remains/trades below the 226.26, the reached final 2016 high will have been only the next important lower countertrend high and the Trump high just the next important lower countertrend high in the overriding bear market.
The week candle after the # 14 broke finally the 1*1 Angle. Therewith, the 1*2 Angle to be worked off was activated as next important downtarget in the current trend, according to the important Gann Angle trading rules developed by W. D. Gann.
Furthermore, you see that last week = # 20 of the downtrend worked off the 1*2 Gann Angle. Indeed, it did pinpoint. Thus, time and price were in perfect accordance at the current sell-off low. The low of last trading week may have been the end of the sell-off. A 30% chance, as I see it now…
What militates against a final low at the reached 160.25 is the weekly trend count. Since last week was the 20th of the downtrend, final changes not using to occur before the 21st resp. 22nd (21+1), it will be allowed to go lower once more by a schnapps. The 22nd week of the downtrend will end at the last day of the year, December 30. Per se, the last resp. the first trading days of a year are important turn dates. Besides, I wouldn’t be astonished if this year again the Big Boys wanted to press down the precious-metal sector resp. the HUI = Gold and Silver Miners until the last day of the year… window-dressing aspects.
==> In case the Thursday low of 160.25 is fallen below the coming days, the HUI would have to fall down to the important strong middle of the first square support at 149-150 bottoming there, accomplishing there the positive backtest of the final year-2014 low environment and starting there a 2-3 months lasting countertrend up to about 222!
==> So, I expect a backtest of the lower line of the 2nd to happen till March 2017 at the latest without violating the Trump high or even re-conquering it in order to confirm a sustainable bull market.
==> After a negative backtest of the lower line of 2nd double arc, the HUI should have to downtrend for the rest of 2017. According to present knowledge, I dare to doubt whether the "round" 100 newly bears in this expected downleg...
In December of last year already, the announcement of the Fed to raise the US rates for the first time after nearly 10 years, quasi meant the end of a long lean period in the precious-metal area. Even though I’m still in a hefty doubt of the precious-metal bear market to have marked its final end with the lows attained between December 2015 and January 2016, in my opinion also the second rate hike announced last Wednesday is good for important intermediate lows:
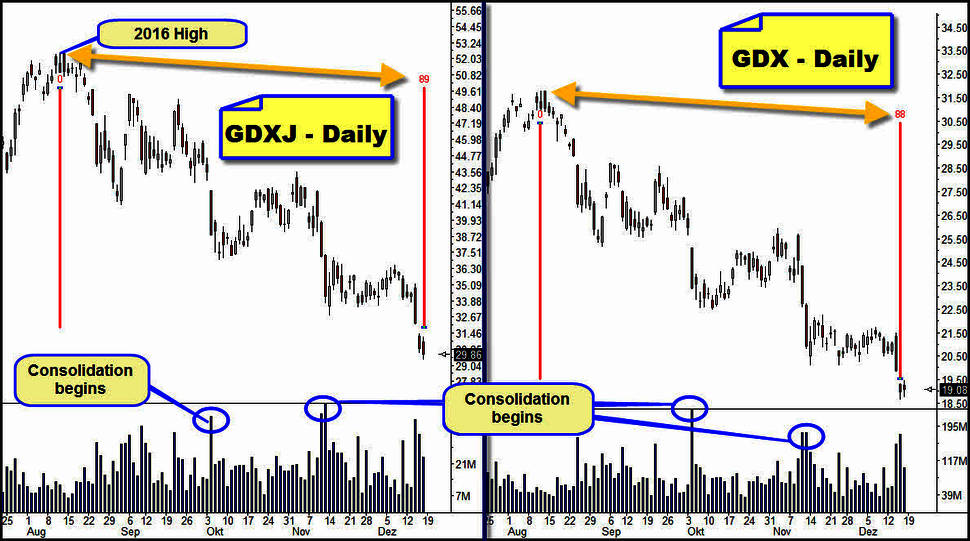
Above, you see the daily graph for the GDXJ ETF left and the GDX ETF right.
Together with the currently achieved brutally negative extreme values of the sentiment indicators, the downtrend count after the reached final 2016 highs well-nigh stinks of the sell wave started on late Wednesday after the FOMC rate hike decision to turn out ultimately as a bear trap.
It’s actually conspicuous that the GDX reaches new lows after exactly 89 days of downtrend, one trading day after the FOMC meeting, with extremely high volumes. GDXJ shows its present downtrend low on Friday, 89 trading days after the final 2016 high being reached. Since the high Fib number 89 often suggests important extrema, that might have been about the downtrend already. Thursday resp. Friday may have been the final low of the downtrend…
==> Therefore this signal situation at the HUI: If the lows of Thursday resp. Friday are fallen below once more, there should be once again the little dip onto HUI 149/150!
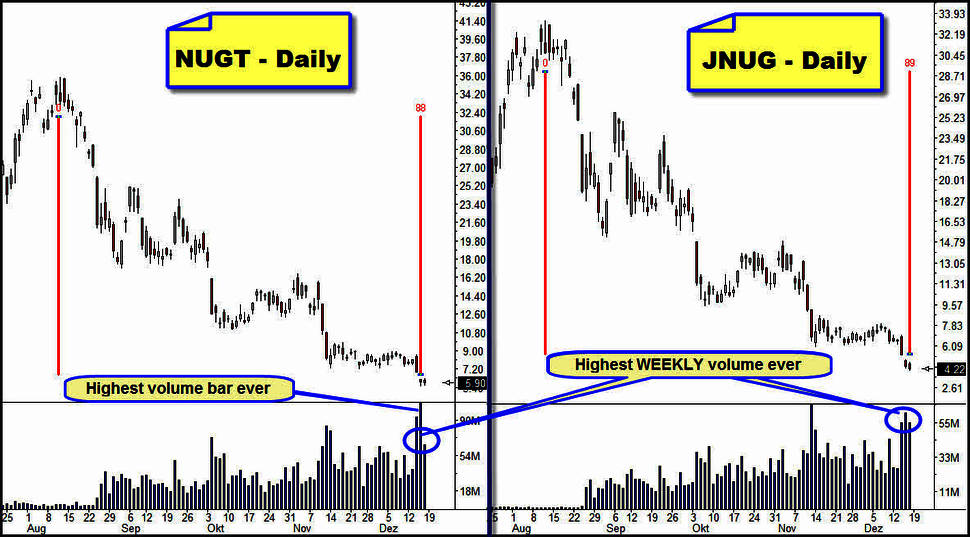
Of course, also the 3x Bull ETFs NUGT and JNUG present current lows 88 resp. 89 days after the day of the year high:
Besides, at both 3 times leveraged ETFs we clearly have to speak of attained panic lows because the NUGT A) shows its highest ever traded daily volume on Thursday and B) NUGT as well as C) JNUG show the respectively highest ever traded weekly volumes with last week.
Well, many things match, so the Mining Sector will have to turn soon, unless it already bottomed finally on Thursday/Friday:
A) Tremendous panic = huge volumes into current lows.
B) Sentiment so much down to the bottom as last exactly 1 year ago. 1-Year-Cycle!
C) Into the massively oversold daily and weekly charts we don’t even have to try to go…
D) Why this panic after 88/89 days of downtrend, given that everybody knew that the rates would have had to be raised last Wednesday?
E) At the end of a possibly determining 89 Fib number cycle?
I wish you a blessed peaceful Christmas and a Happy New Year!
Be prepared!
Eduard Altmann


