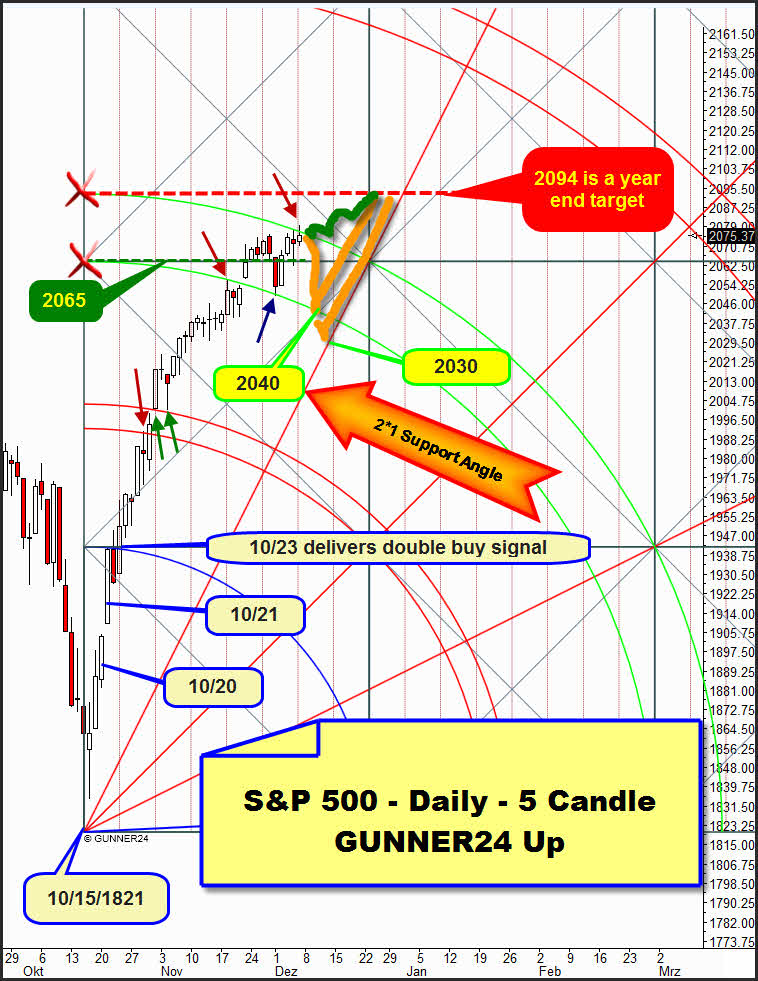
To enlighten the situation of the current gold swing let’s get started determining for sure what an up impulse coming from an important low looks like the ideal/optimum way. As an example respectively as object-lesson for structural sustainability of a first move out of an important low, I chose the S&P 500 index. I did so considering its course from the last important correction low – made at 1821 points on October 15.
Therewith we can kill two birds with one stone: On the one hand, I can briefly go into the furthermore expected course/forecast of the S&P 500 through year-end. On the other hand, this very example makes obvious that gold can/should newly be just in a countertrend move on daily base, thus the gold-bulls keep on suffering:
As early as 3 and at the latest 4 days after the October 15 low was to be realized and divined that the move out of the low may turn out very sustainable, I mean far-reaching in terms of price and time.
In respect of the sustainability of a move out of a low, my main concern is not the performance of the very day of the low, but of the coming days after a potential low in regard to opening and closing price, range and gains! In the chosen example above, the day candle of the 15th looks very promising once already as far as the potential sustainability of the low is concerned. For the 15th shows an extremely long lower wick what points strongly to a possible exhaustion of the preceding trend. October 15 closed in a minus in spite of the visible potential exhaustion. A still longer lasting impression for a sustainable low would have arisen if 10/15 has closed in the positive region.
The day after the low shows a nice gain, it openened lower as close was. On that 16th the low of the 15th was not tested any more. The 16th closed more or less where the 15th had closed. Admittedly, the 16th reached a higher high than the 15th did. In fact, the course of the 16th doesn’t give any hint to the sustainability of the 15th’s low however. With the candle of the 16th, nor we recognize any emerging buy panic, let alone the question whether the move out of the low is mannered impulsive or corrective respectively bound to be impulsive (new higher trend-highs are possible) or corrective (after a bounce in the downtrend the preceding low is tested and probably fallen below).
First indications that the market indeed is being bought – tangibly bought – are given by the course of 10/17. We realize that the 17th opens above the closing price of the 16th. A gap arises, and the candle body of the 17th shows a promisingly long range thus being above the opening of the 15th as well with it closing price. Thereby we ascertain that the 17th delivers a reversal, the very first daily buy signal since the low.
In fact, crisply confirmed is the rise out of the low on 10/20. That day closes at the daily high. In addition, we count the 3rd consecutive day of price rises. The same pattern is to be made out for the 21st - close at the daily high. Further indications that point to an up-impulse since the low are the next opening gap and above all the long body range of the 21st.
Then, on 10/22, we recognize the first minus day since the low. Indeed the 22nd closes at the daily low, but the close is just only in the middle of the range of the 22nd. Thus, we don’t see any overlapping of the candle body of the 22nd with the candle body of the 21st. Thereby, no reversal candle arises!
Furthermore, the 22nd could mark a new impulse high.
The fact that since the low a real up impulse goes is fed on the 23rd by the final break of the first square line resistance and the Blue Arc Resistance, since a GUNNER24 Double Buy Candle arises… thereby some further, higher magnets are activated as targets.
The conclusion respectively quintessence of the description of the performance out of a low is the following ==> NOTHING IS TO BE REALIZED THAT MIGHT PRODUCE HARASSING FIRE! No contradiction indicating that the move out of the low falters somehow. Many, many advantages are produced by the different candles after the low. No counterpoint is realizable that might impede the sustainability of the first move out of the low. All is clean… And what about gold – a little further down – really just dirty things and harassing fire are to be stated.
But, before I go into the current gold countertrend including possible uptargets, here is as promised – the forecast of the S&P 500 till year-end.
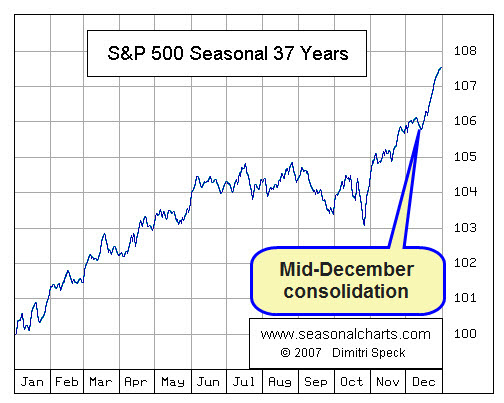
With Monday, the traditionally weakest December week in the US stock markets begins:
Source: http://www.seasonalcharts.com/classics_sp.html
With the beginning of a consolidation on a very high level we’ll have to reckon on Monday respectively Tuesday. The market consolidation during 5-8 trading days would just correspond with the normal course of the last 37 years. After the end of the consolidation period, mostly the Xmas rally begins/the year-end rally is continued.
If the presumably very soon starting consolidation lasts 5 days, we’ll MAXIMALLY have to reckon with a new test of the lower line of the 2nd double arc support at 2040 index points. The lower line of th 2nd double arc is now a very strong daily support, as this is where the low of the last trading week is. Mind about this low at the blue arrow.
If the consolidation wants do last 8 days, it may maximally lead to a non-sustainable break of the lower line of the 2nd going to the very first test of the 2*1 Support Angle, I mean reaching the 2030.
From maximally 2030 respectively 2040, then another upswing would have to start reaching at least the 2094 horizontal till year-end, maybe 2100! At around 2090-2100, the year closing price is supposed to be.
Both options are visually simulated with the orange forecast paths sketched in the daily 5 Candle GUNNER24 Up Setup above.
The uptrend is that strong and sustainable, so during the expected consolidation any price within the lines of the 2nd may also facilitate the end of the consolidation. Thus, the consolidation may end already at 2060, 2055, 2050 etc.
The market pays attention to the lower and upper lines of the first and 2nd double arcs. We realize only weak resistances at the lower line of the 1st and the lower line of the 2nd however. Please, mind about the both red arrows about this. Not more than one day of recess at the lower line of the 1st, respectively the lower line of the 2nd led to 3 days of recess! ==> So it may thoroughly be possible that the upper line of the 2nd will be rapidly broken upwards, the market wanting to continue its strong uptrend unbraked and furthermore without visible consolidation instead of consolidating for the next 1-2 weeks. This way of development is depicted with the green forecast course.
==> An unambiguous daily close above the upper line of the 2nd (a daily close above 2083 or higher!!) through next Tuesday makes this path into the 2090-2100 likely to materialize until year-end!
Gold countertrend targets are 1216, 1210, maximally it might come to 1230-1234, then the 1100 should be targeted.
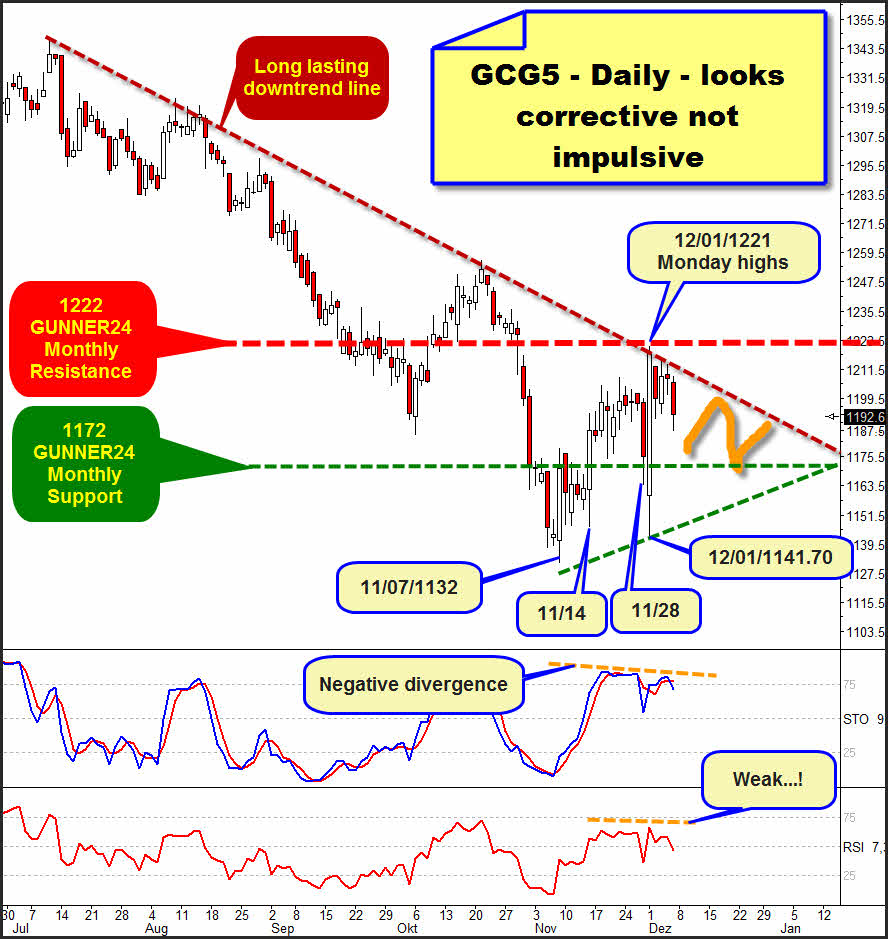
I think, that gold can only be in a countertrend move since the 1132 low of 11/07. The very first indication to that can be found at the first candle after the low already. That one is falling from the opening through the close. Admittedly, it closes far above the 11/07-downtrend low, but it marks a lower close than the low candle. This is the clear first evidence that the recuperation from the low cannot be lasting somehow because it doesn’t go on upwards briskly. The candle of the 11/07 low was a very promissing outside reversal but day after low no follow through is seen. So the question is allowed: Was day of low perhaps just a short-covering action?!
It’s the first harassing fire. With the day after the low begins a consolidation period of 4 days already, with lower daily highs and lower daily lows. So we have to ask us the question where the sustainability of a possible up-move is to be found if the first day after the low has to fight with an important monthly resistance already (1172), starting one day after the low a 4 day consolidation period = harassing fire!
After the consolidation period, from the low of 11/14 (next! outside reversal day) a new up-move begins, lasting 2 days and then being interrupted again by a consolidation – at a high level. Within this consolidation we recognize a down gap at the opening = harassing fire and a daily low that is a little bit too low = harassing fire. Then comes a new swing high followed by 3 days of consolidation.
Afterwards follows of course the Thanksgiving sell-off (11/28) leading to the important 1141.60 low of last Monday including next outside reversal day = monster-reversal up to the daily downtrend line and the well-known 1222 GUNNER24 Resistance. Just the fact that a sell-off shows within a recuperation can only point to a countertrend.
==>> Up, down, undecided, reversal, large down candle body, huge up candle body, consolidation, bounce at important resistances, sell-offs, short-covering action or real buying?! The entire action since the low of November 7 is not impulsive, since again and again facts arise that disturb and impede a lasting up-move.
==> So, since the move from the downtrend low of 11/07 it can only be a matter of a countertrend. Ergo, this whole downtrend in the weekly and monthly time frames has not ended with the current downtrend low. It will take further lower lows, whenever they may come along!
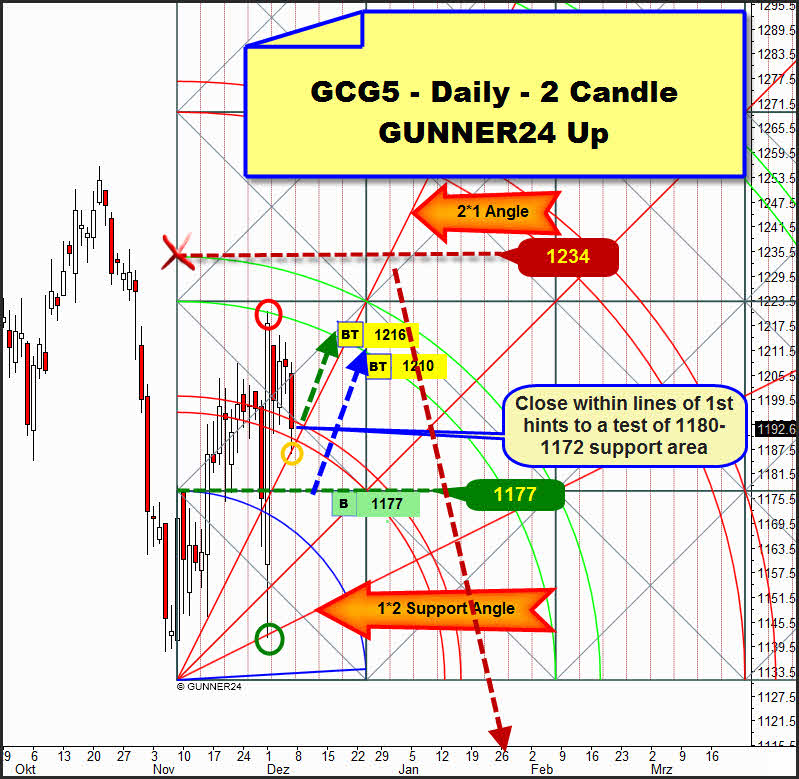
Above you see the current up setup of the market. The next choice of possibilities for gold is actually limited.
Firstly: Immediately, beginning Monday, gold starts an up-move at the next test of the 2*1 Angle that in 7 trading days leads up to 1216$, the next test of the lower line of the 2nd… Watch the green arrow scenario.
Or, what secondly seems to be much more likely, owing to the downwards turning Slow Stochastic Indicator including negative divergence and the rather weak condition of the RSI as well as the weak Friday close within the lines of the first double arc:
Again, till next Wednesday, gold will target and test the support region between 1180 (important downtrend low support of the years 2013+2014) and 1172 (GUNNER24 Horizontal Support on monthly base) beginning to rise from there in order to complete the presumably necessary next test of the lower line of the 2nd double arc close to 1210$. In addition, at 1177 the first square line support of the 2 candle up setup above is situated. I think the daily 1177 horizontal support is a pretty good entry point for a long-position with target 1210. Watch the blue arrow scenario.
Technically, with the next test of the 2nd double arc the whole countertrend move since the 11/07 low with a lower high at the lower line of the 2nd environment should have to end respectively to be finished = lower countertrend high at 1216 respectively 1210. Then and from there, actually the next powerful downleg with target 1100 should start!
If however a daily close above the lower line of the 2nd double arc resistance succeeds till Xmas, the bounce WILL perhaps go up exactly to the 1234, next higher GUNNER24 Horizontal Resistance, before from there the next powerful downleg with target 1100 would have to start.
In these whipsaw markets of the last weeks that might confuse any trader thus leading mercilessly to burning the trading account the professional signals have got their special importance. You get them in the GUNNER24 Gold Trader!
You best register with our GUNNER24 Gold Trader now. That’s where we oversee the optimal entries and exits for you. Especially in the difficult market situations where many factors have to be considered the Gold Trader is backed by the additional GUNNER24 Signals based on the combined 1, 4 and 8 hour setups to catch the optimum entries and exits.
The GUNNER24 Gold Trader will provide you with the critical knowledge you need to forecast and analyse the precious metals with the GUNNER24 Forecasting Method. All the GUNNER24 Trading Signals you receive real-time are based on the actual Gold and Silver Future. The NEW GUNNER24 Gold Trader is a must for every actively working investor and trader who wants to trade successfully in everyday trading. The insights you receive from the head trader Eduard Altmann (and discoverer of the GUNNER24 Forecasting Method) are truly amazing sometimes. I promise!
Click the button below and order the GUNNER24 Gold Trader - $39.90 US a month. For 201 members and up - $49.90 US a month.
Be prepared!
Eduard Altmann


