And again, it continues with the US stock market rally. On Friday, the very first day of the new month, the course lows of December were actually cemented in the US stock markets. It may be that until Wednesday the Friday lows are again seriously approached, but I think the final December lows are in with a probability of over 80%.
Ergo: stay long or buy more until the sky falls on our heads, because it remains true that the leading US stock market indexes should reach their individual annual highs only towards the end of December. The likelihood that the last trading day of the year 2017 brings the annual highs continues to be extraordinarily hiiiiiiigh!
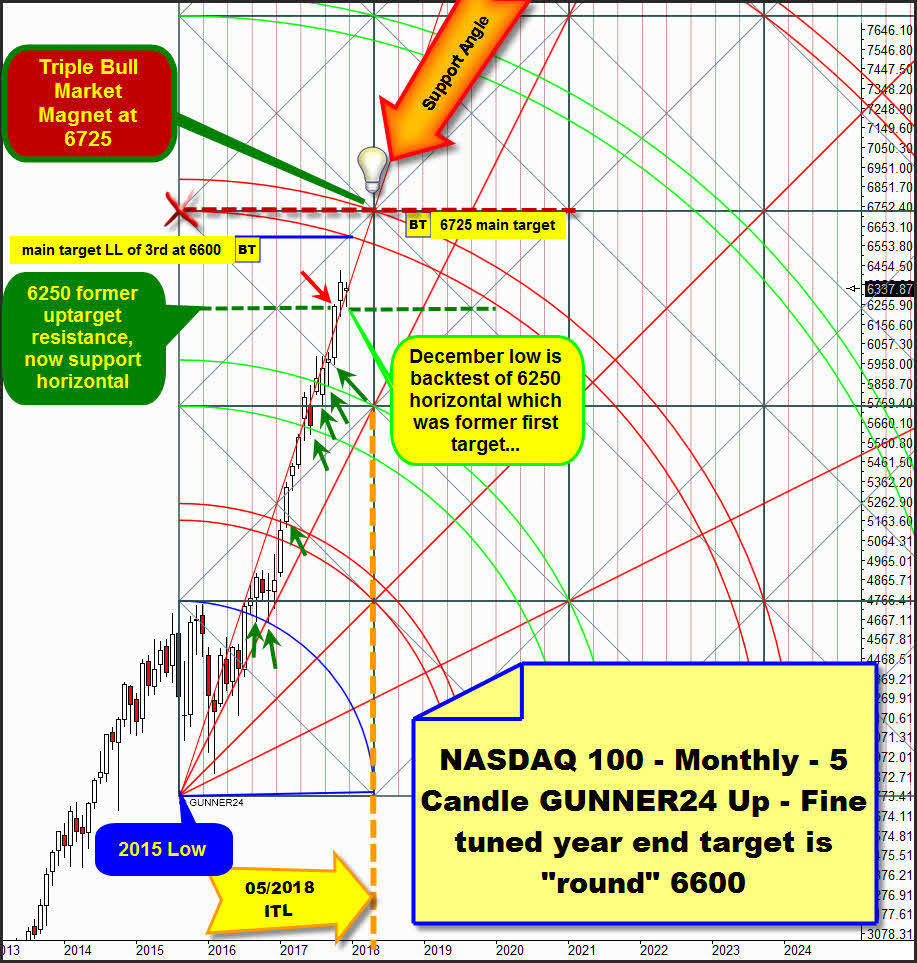
==> Important observation: I suspect that the final December lows are made because, among other things, the just weak NASDAQ-100 on Friday testded back an important natural GUNNER24 Horizontal Support in the monthly chart, already very accurate and very noticable:
In my 10/15/2017 NASDAQ-100 forecast - This US stock bull market remains unbelievably strong until about April 2018 - I claimed: "The leading NASDAQ-100 index will reach 6555 index points (+95% odd) by May 2018 at the latest." ... "New main uptarget for the NASDAQ-100 bull market is the lower line of 3rd double arc. Lower line of 3rd double arc upmagnet could be worked off and tested in course of May 2018. Then the lower line of 3rd double arc is at 6555pts and the next ITL awaits the market!" ... and: "... "it seems that next higher important resistance which is the 6250-midle of current square horizontal resistance could be reached until year end. At least!"
==> So, 6250pts resistance WAS! the closest important uptarget above, a very important open uptarget for the year 2017! On 10/15/2017 it was stated: 6250 threshold is first uptarget for NASDAQ-100!
If you now look up at the chart and still dominating monthly 5 Candle up starting at final 2015 Low you will notice that the with red arrow highlighted October 2017 close and high was braked by that GUNNER24 Horizontal Resistance. October high is 6258.42pts, October close arrived at 6248.56pts.
Thereafter, the market in November cleared 6250 horizontal, just for stopping at new alltime-high which is now at 6426.04, followed by the backtest of 6250 on the first trading day of the new month of December. I think it`s hardly clear: Fridays low action was backtest of previously upwards broken 6250 monthly resistance. A very successful backtest as it seems as the markets likely will open next trading week with mighty upwards gaps after US Senate on Saturday narrowly approved the tax reform.
==> With an 80% odd NASDAQ-100 - along with the other major US indexes - printed its bearish December extreme on the first day of trading. So now he is very bullish again and should be able to work off its previously activated monthly main uptarget which is the lower line (LL) of 3rd within setup above.
By the way... the November 2017 close above the Support Angle was a next strong GUNNER24 Buy Signal in the monthly time frame! This bullish close above a former important Resistance Angle out of 2015 Low is harbinger that the bull run is getting more and more traction and I stick to it that the lower line of 3rd has to be worked off within this monthly upcycle with a 99.9% probability. Think now that the lower line of 3rd double arc main uptarget is tested into year end. Then - for December and January candle - lower line of 3rd main target is at the "round" 6600 pts threshold!
==> Fine tuned NASDAQ-100 uptarget is at 6600. 6600 (+- 10) might be the final 2017 high!
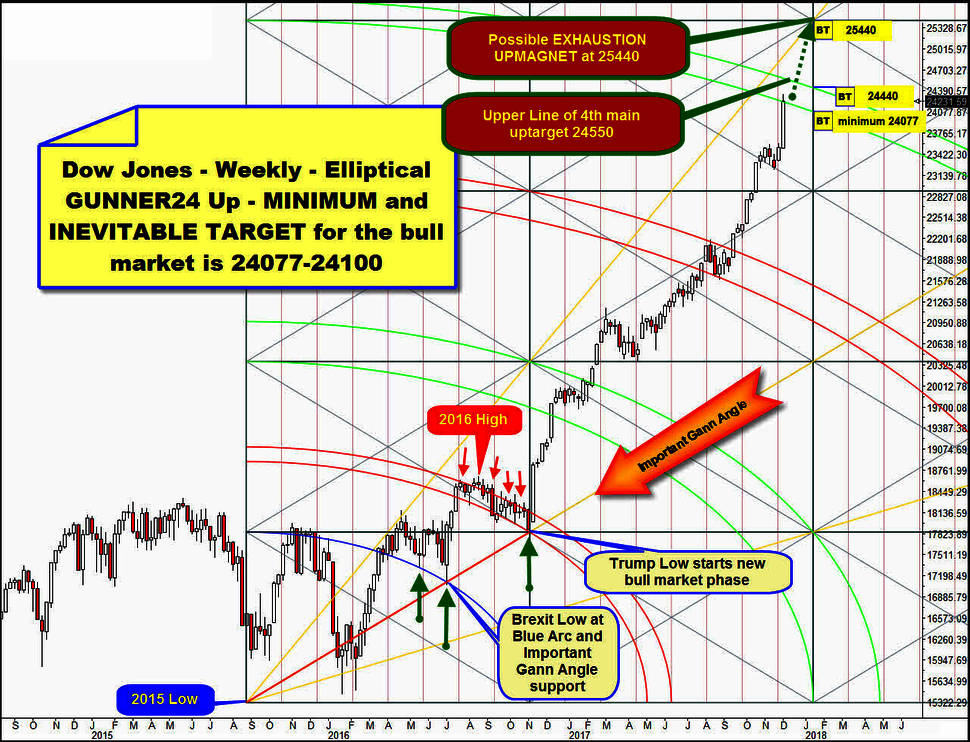
For a few weeks it was clear that the Dow Jones has to reach 24100pts at least. 24100 was INEVITABLE UPTARGET for the bull run:
Here: http://www.gunner24.com/newsletter/nl-101517/
and here: "Dow Jones should hit 24100 at January 2018 top"
I used the above elliptical weekly Dow Jones for the very first time on 11/12 for the evaluation of the likely main targets of the index. Most important cornerstone of current bull market is the 2015 Low, there and then the setup starts measuring. And together with the year 2016 Brexit Low and another week low precisely at Blue Arc support from above and the 2016 High inspired by 1st double arc resistance environment and the resulting long pullback into the Trump Low which obviously was oriented to the slightly falling 1st double arc resistance and Brexit Low as Trump Low precisely at Important Gann Angle support from above we count all in all 8 cornerstones which link the position of the first rectangle in the setup meaning fully and absolutely logically.
At the Trump Low, this current underway bull market started to accelerate right after he moved into next rectangle and after the 3rd double arc finally was overcome in course of summer 2017 the lower line of 4th resp. whole 4th upwards resistance area became next mathematically uptarget for the bull.
Now a quick look at the chart is enough to realize that this target has been achieved. 24100 INEVITABLE UPTARGET is worked off and was clearly overshoot with past week close at 24231.59 and next alltime-high (24327.82). This results in even higher upside target for this bull run...
Nearest uptarget is 24440. 24440 is the next INEVITABLE UPTARGET for the Dow Jones! = it should be reached with a 100% odd! Watch, where the past week candle closed. Precisely at lower line of 4th main target. This close is a to the T test of main uptarget from below and this confirms existing resistance importance of the arc. Because the next trading week is expected to open above the lower line of 4th, this event activates the upper line of 4th double arc as next important bull market target.
Of course, this new, slightly higher bull market target in the current exaggeration cycle is likely to be achieved very quickly, even within next 5 trading days!!! Upper line of 4th is at 24550 for next week candle. Think the 24550 upwards resistance magnet working off is due until year end and possible annual high environment. Hmm, give 24550 + round about 50 pts = 24600pts for the possible final 2017 high.
The past week candle was biggest 5 day advance since Trump elect, this is usually an unmistakable sign that something "new" in trend direction has begun. And that may mean that the market now only mercilessly wants to pull up until this bull market eventually and somewhere exhausts by itself because hardly any buyers are left to push it further up. During periods of exaggeration into important cyclical highs very very high prices can be achieved.
==> Elliptical setup offers a possible exhaustion price/time target at 25540 for mid-January 2018! 25540 exhaustion target is activated if a week close above 24605pts is reached by x-mas.
December is the second best month on the Dow Jones since 1950. Also for the NASDAQ`s the December is second best performing month of the year. But for S&P 500 and Russel 2000 December is usually the TOP month of the year. Market trading in December is holiday inspired and fueled by a buying bias throughout the month. However, the first part of the month tends to be weaker as tax-loss selling and year-end portfolio restructuring begins, thats why Friday lows might be visited again the next few days!
Below is a totally new IWM ETF trade setup from my Trade of the Day trading service to complete today`s free newsletter issue. The IWM ETF (iShares Russell 2000 Index Fund) corresponds to the performance of the small-cap Russell 2000 Index, thus we can equate its supposed development into the next important bull market high with the presumable course of the Russel 2000.
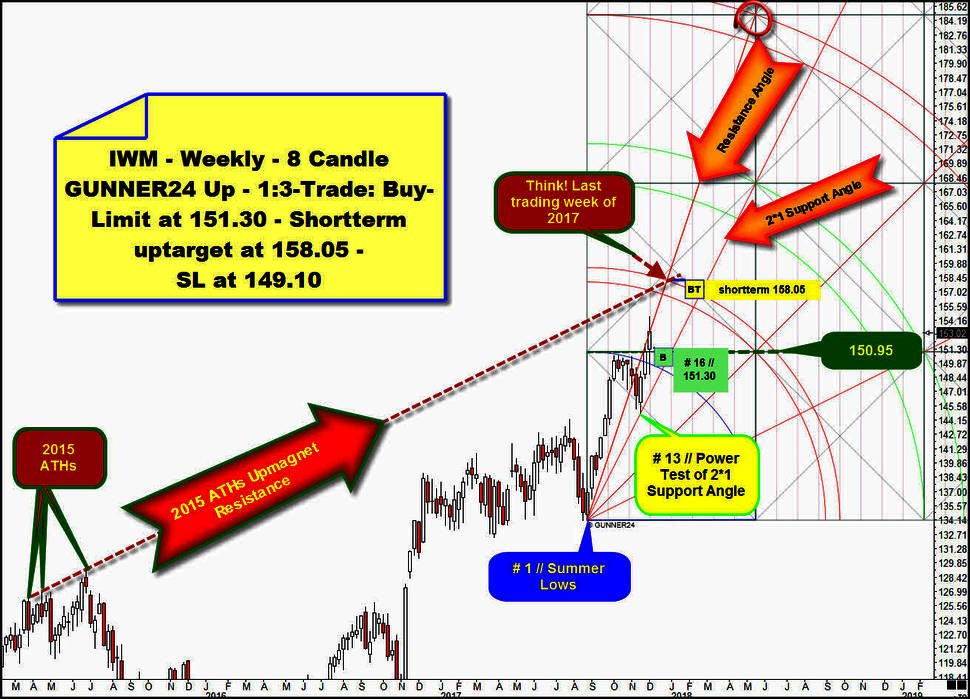
==> 2 weeks ago, we realized that the small-caps must be at the beginning of a powerful rally that should very easy last until the beginning of 2018. Then uptrend week No. 13 tested back usually very strong combined weekly and yearly price support magnet, so price has met time, consequently a change in trend was imminent! Observe how the market went crazy after # 13-lows made at 2*1 Support Angle rising bull market support:
The uptrend which began at the # 1 // Summer Lows fired strong buy candle after uptrend week # 14 closed far above Blue Arc resistance. This was first sign that uptrend should test 1st double arc! See how accurate week # 14-close was still just below 150.95$ first square line resistance. Thus, the importance of the first square line became confirmed. The next liberation succeeded with this week # 15-close above 150.95$ horizontal resistance. IWM closed far, far above first square line, firing the second consecutive GUNNER24 Buy Candle in the weekly time frame.
S&P 500 as Dow Jones are additionally on fire now. We have full confirmation that year-end rally is getting started.
IWM will test 1st double arc upmagnet/uptarget until year end. This is a no brainer call. Fact.
==> This week close above 151$ is the next MAJOR buy signal and finally activates lower line of 1st double arc as next important target in trend direction.
But I expect IWM going higher until this weekly uptrend might finally top! Somehow it smells like market will test the 2015 ATHs Upmagnet Resistance within current weekly upcycle. This very important resistance above was cemented in course of 2015 by 3 small higher alltime-highs and has never been tested back ever since! And as I see it when observing the monthly IWM chart, the 2015 ATHs Upmagnet Resistance should be a very important attraction in the DECADE TIME FRAME!
And this 2015 ATHs Upmagnet Resistance seems to be connected mathematically with the summer lows, resp. with the advance of the first 8 weeks of current weekly upcycle because DECADE RESISTANCE TRAIL intersects Resistance Angle out of # 1 /Summer Lows and upper line of 1st double arc at 158.05$ for the last trading week of 2017.
==> Think IWM could rally until last trading day of the year, perhaps testing the 158$ then.
==> I have now shortterm uptarget at 158.05$.
==> Since this rally should make hardly many prisoners until this year ends, we have to set our long entry close to the current price:
Chosen long entry level is at 151.30$. Entry is at # 15 opening auction.
==> Please place a 1:3-IWM Buy-Limit order at 151.30$. The Buy-Limit order is valid until Friday, 8th of December.
- with daily trades – quick, safe and profitable…
- in well-chosen precious metals, commodities, indexes, currencies and in the best trending stocks worldwide...
- in both rising and falling markets…
- with little use of capital…
Be prepared!
Eduard Altmann


