The Precious Metal markets took a punch last Monday because of coronavirus vaccine news and the gold futures contract dropped more than 100$ in just one day.
Extreme high bearish energy levels we have last seen in the February to March 2020 coronavirus panic selling cycle which could cause gold to drop further into the end of the year.
However, there is enough hope for the gold bugs that with the next small lower correction low of the week (1848$), what is now the so far absolute low of the correction, the entire correction cycle has ended!
Because this is now valid: 2 different weekly GUNNER24 Setups show this possibility at the same time.
But IF the gold prints another lower correction low AND a weekly close below 1846$ UNTIL END of NOVEMBER, the gold is expected to drop further into year end and should backtest big, big MAJOR GUNNER24 Support Horizontal of 1772$.
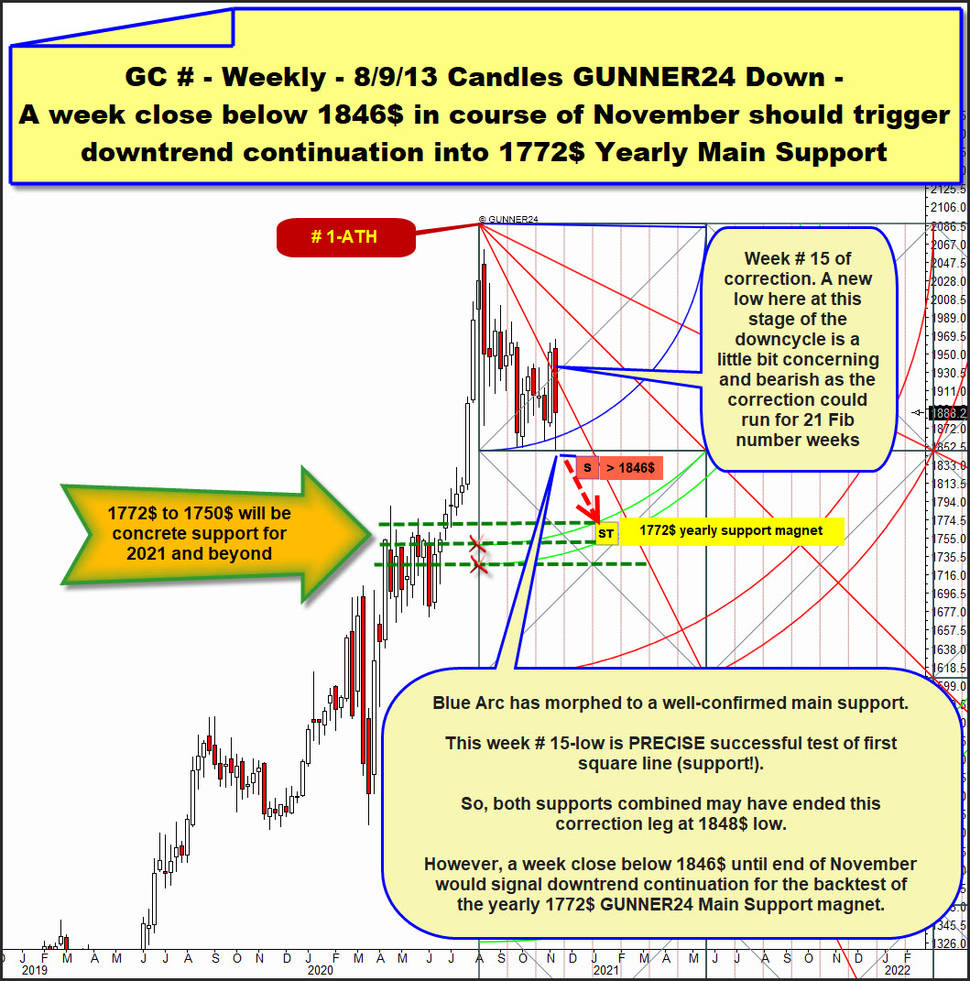
We can study this at alltime-high (ATH) started gold correction cycle and its resulting signals in detail. With the help of this next following weekly 8/9/13 Candles GUNNER24 Down Setup.
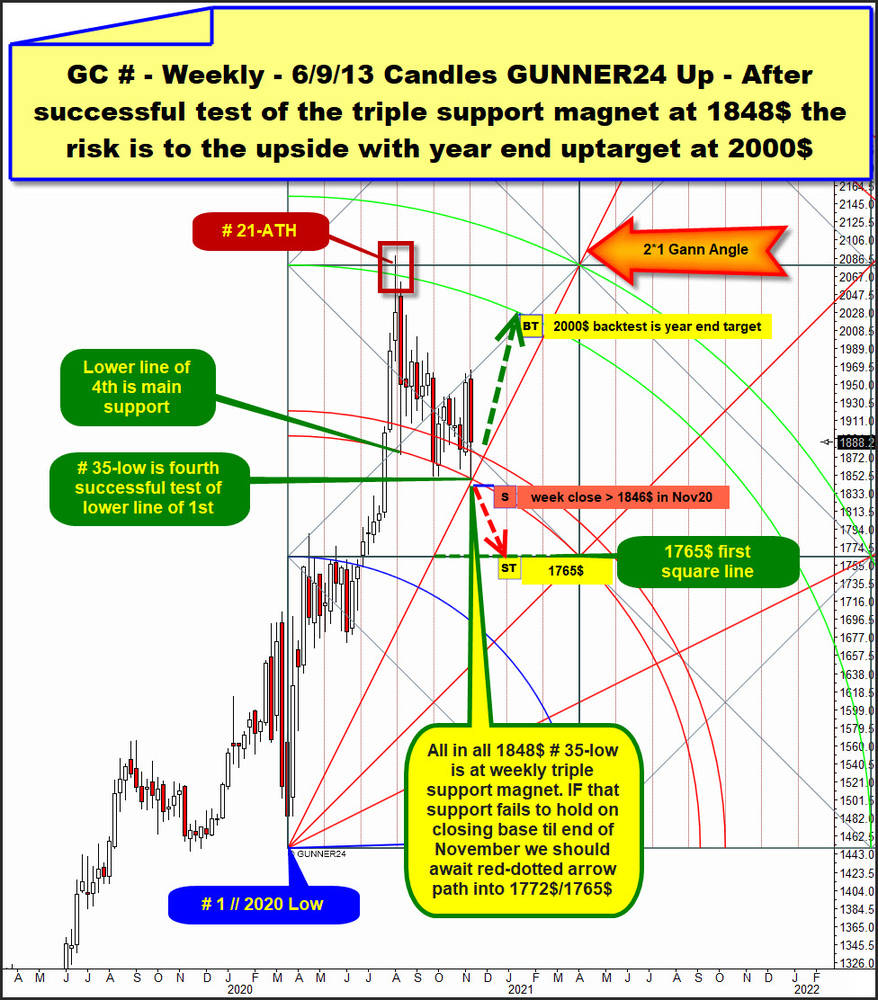
The at the final 2020 Low triggerd overall bull market we can analyze with the help of a weekly 6/9/13 GUNNER24 Up Setup. This is then the next but one picture. The two views taken together – longterm bull market vs. midterm corrrection cycle – allow us to conclude that the final low of this correction might be the on Monday served 1848$.
Blue Arc remains main support because it is triple confirmed week low rail. Two of the correction lows which define the course of the Blue Arc are oriented to a Fib number. The 8 & 13. Such 3 exact confirmations of the Blue Arc is somewhat rare and this is why it is main support of this correction what for the week is at No. 15.
This week correction low was the very accurate first test of the first square line what is automatic support out of ATH and Blue Arc combined.
==> Now Blue Arc and the first square line are future main supports for gold. Both radiate week low support and weekly closing base support.
Therefore this is now a valid resp. solid view:
1. Both supports together and combined might be responsible for the final low of the correction and could trigger a weekly bounce cycle starting soon what could be stronger evidence that this week 1848$ is the final or another next midterm low of the correction.
2. This week 1848$ could be the final low of the entire correction as long the Blue Arc & first square line will not be broken downward on weekly closing base.
But the bulls should fear a week close below the 1846$ first square line support rail as such week close would have broken both supports in one go, and usually such a then lowest correction close triggers the red-dotted arrow downcycle path what usually should test 1st double arc support downtarget and the 1772$ Main GUNNER24 Support Horizontal towards week # 21 Fib number of downtrend.
==> The official sell-signal is IF the gold prints a week close below below 1848$ first square line support until end of November it has to come to the very textbook backtest of the yearly 1772$ GUNNER24 Support Horizontal backtest magnet arround the end of 2020!
But as this weekly 6/9/13 Candles GUNNER24 Up Setup captures the correction cycle and the latest developments the gold bulls may well get a little euphoric.
This above is actually best working weekly GUNNER24 Up Setup. First to work on is the count of the 2020 bull market.
The likely final top of 2020 and current ATH is printed at the end of a weekly 21 Fib number rally cycle what nearly exactly topped at natural bull market uptarget of lower line of 2nd double arc. There the time has met price and this event ended the rally cycle and started the correction phase what for the week is the 35th week of the bull market. This is of course 35 - 1 = 34 Fib number, possible big trend turn number.
This week # 35-low was the third/fourth backtest of lower line of 1st what for sure is another main support arc of this correction. The low also was the very first test of the 2*1 Gann Angle from above.
Usually this 2*1 Angle should radiate yearly support. Stronger support energy here at actual very first test!
This week low is at combined weekly and yearly support magnet and additionally with a 100% accuracy arrived at a triple support magnet (+ first square line within weekly 8/9/13 Candles down) on weekly base!
==> Therefore this bullish option has set up: correction maybe finally has ended at 1848$ as the time has met price and this event signals a change in trend is imminent. This probability has a good chance of success because 2*1 Angles usually trigger maximum-bull energy after the first successful test from above, so the phat dark-greed dotted upward arrow for the re-test of the lower line of 2nd double arc and the very important 2000$ number upmagnets until end of December has soom nice odd to come true.
It looks like the next week will be very important because we will see the reaction of the market participiants on that first 2*1 Gann Angle test.
In case that the gold prints a daily close above the 1900$ in course of the next 5 days, the price will most likely return to a current local bullish trend and we should see bullish continuation at least to 1922$ supply level and I think the next future weekly close above a 1922$ is the first very strong confirmation that it want`s the serious classic backtest of lower line of 2nd/round 2000$ W.D. Gann upmagnet resistances until the end of 2020.
I can well imagine once & IF the lower line of 1st double arc support breaks down together with yearly 2*1 Main Support Angle til end of November, the Gold Bugs will be burned and the backtest of the yearly 1772$-1765$ support magnet range will be just a question of when ...
Be prepared!
Eduard Altmann


