The most wonderful thing about a bull market consistently making higher alltime-highs over the years is that every long position, no matter when and where it was taken, becomes a winner in the long run and brings us some money.
This circumstance or this win-win situation is valid until the bull market ends. At least theoretically!Thus, actually every dip, every pullback or any correction in the confirmed bull market is always an ideal buying opportunity; which will eventually make the cash register ring. Any break, dip after dip, pullback after pullback, no matter, every bull market trading at alltime-highs screams "buy me, buy me" right in the face.
The trick - of course - is to recognize or suspect when the current run could then end. When will it be dangerous for the trader, investor and the bull market?
Today, with the help of the Dow Jones in the weekly scale and a very interesting GUNNER24 Up setup, I try to pin down the possible end of this win-win situation!
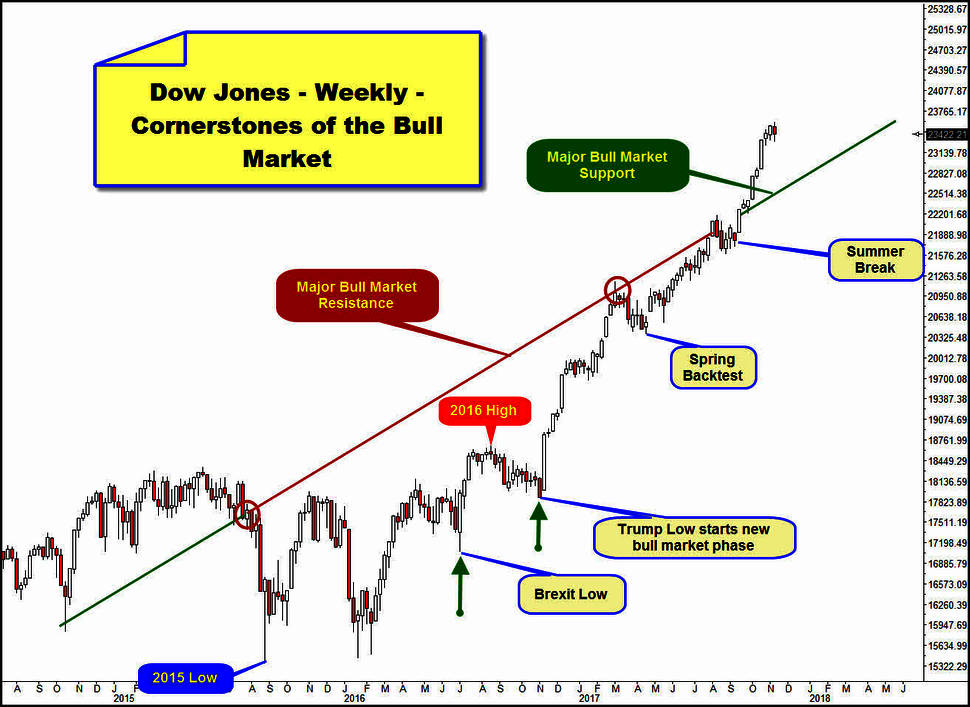
Above you recognize the weekly candles since August 2014. This Dow Jones bull market started at 2015 Low, which was a spike low, signaling complete bearish exhaustion. In the chart, I have highlighted some important waypoints of the bull run, which are important for the following weekly elliptical GUNNER24 Setup:
Most important cornerstone is the 2015 Low, there and then the setup starts measuring.
In 2016, these important things happened: Brexit Low, which was also important higher bull market spike low. Year high and the Trump Low that was another important higher bull market low and which triggered the current phase of this bull market. Trump Low released this buying stampede, the almost enervating series of higher alltime-highs in course of 2017.
In 2017, there were just two short breaks/pullbacks in the bull run: 8 weeks lasting "Spring Backtest" and a 3-weeks "Summer Break". At Summer Break Low, the next rocket stage was detonated and as a result the index managed to overcome former Major Bull Market Resistance, now Major Bull Market Support.
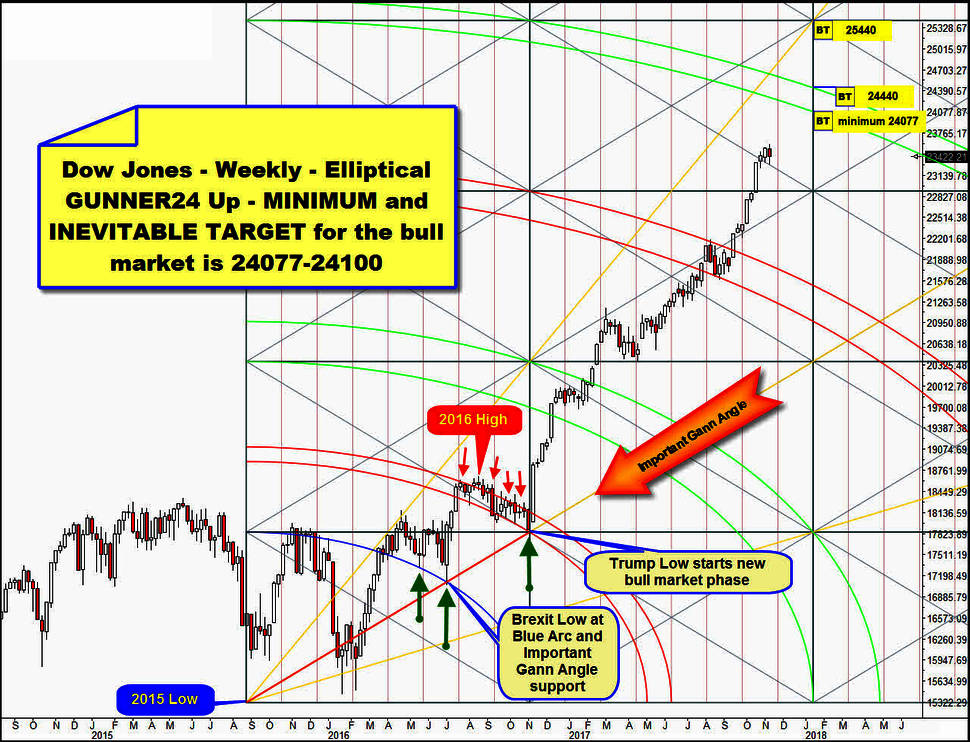
==> At Trump Low underway buying frenzy was triggered, consequently this time/price point is also the second most important pillar of following elliptical weekly GUNNER24 Up Setup:
And together with the year 2016 Brexit Low and another week low precisely at Blue Arc support from above and the 2016 High inspired by 1st double arc resistance environment and the resulting long pullback into the Trump Low which obviously was oriented to the slightly falling 1st double arc resistance and Brexit Low as Trump Low precisely at Important Gann Angle support from above we count all in all 8 cornerstones which link the position of the first rectangle (1) in the setup meaning fully and absolutely logically.
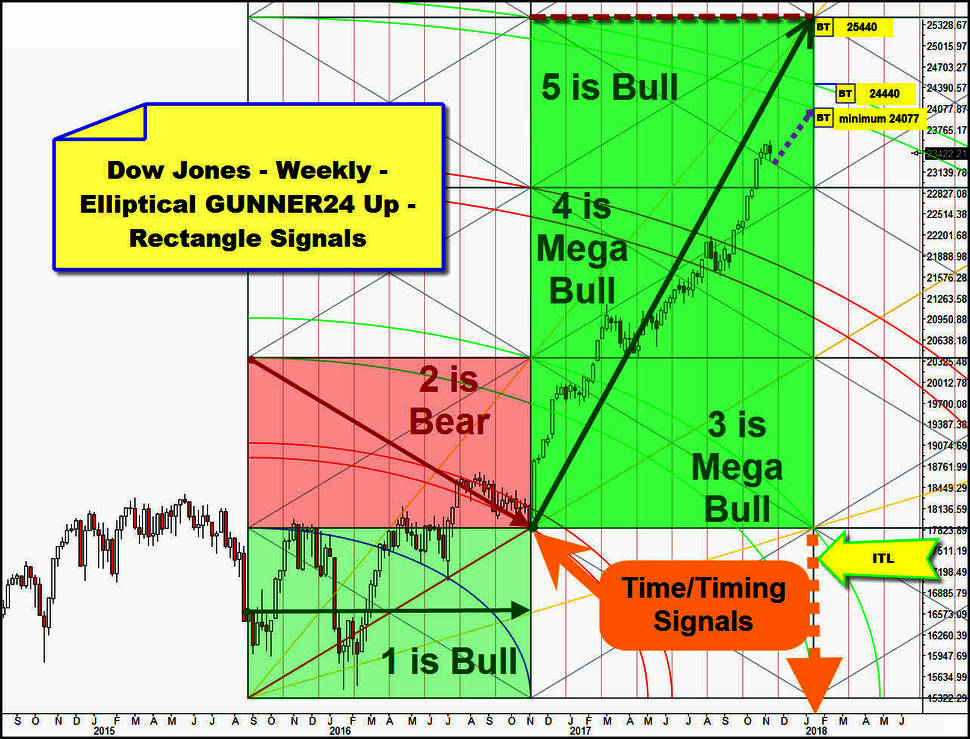
If the first (1) rectangle is mathematically revealed, it automatically deduces the location of all other 24 rectangles of the setup... I mean, we can interpret the history of this bull market based on the setup as follows:
Rectangle 1 is/was a bullish backed one = bullish period within the bull found its starting price and formed higher lows, gathered strenght, tensed it muscles. Rectangle 2 was a resistance area and resistance period with final highs of 2015 and 2016 printed within, bull was allowed to pierce that resistance rectangle but failed within space of (2) and at 1st double arc natural bull market resistance.
At the Trump Low, this bull market started to accelerate right after he moved into rectangle 3. Rectangles 3 and 4 offered no resistance, on the contrary, these had extremely bullish forces that were driving the market extremely high within relative short time. Meanwhile the market is running through the rectangle 5 that is - obviously - a next bullish backed one because market was able to deliver some higher alltime-highs since he stayed in the 5th rectangle.
==> The time when rectangle 3 was reached for the first time was a very important bull signal for the market. It was a time signal in GUNNER24 Terms. The time signal which started the acceleration phase, the current bull stampede cycle and well, I think you know what my next point is, now threatens the end of this period because the market is very close to its next important time line (ITL)!
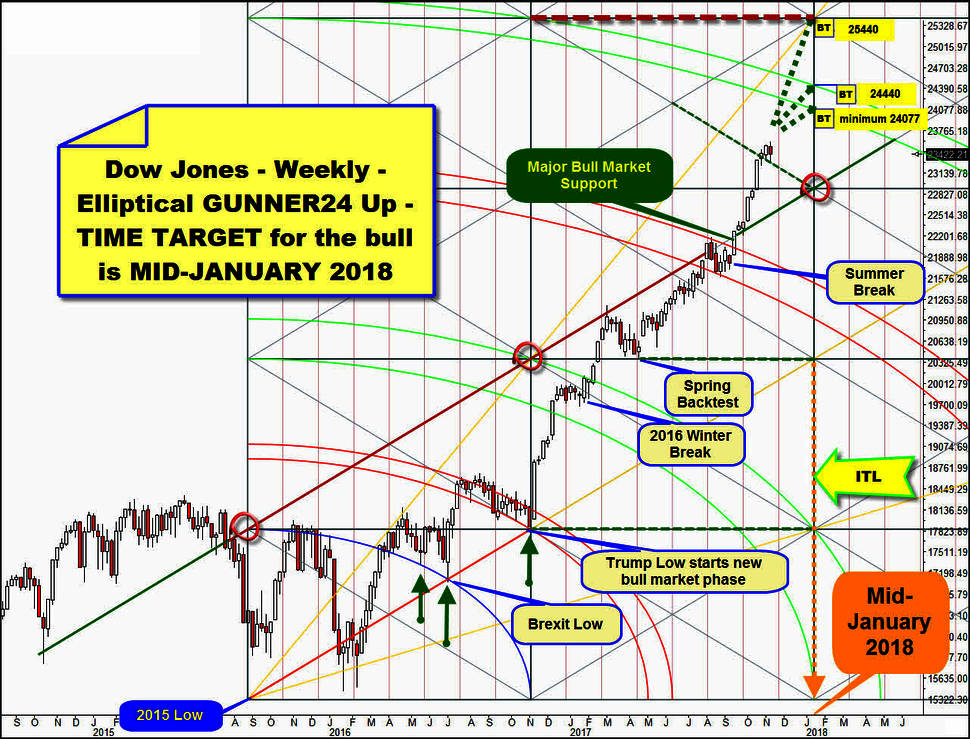
Next ITL marks the right end of rectangles 3, 4 and 5 and intersects the time axis for the trading week January 15-19! The ITL magnets always offer and signal the end of something, an important low or an important high and in this case this upcoming, probably again very important time signal should trigger the end of the previous bullish phase rectangle 3 to 5! Usually the underway powerful bull cycle should exhaust itself and find next important bull market top in course of January 15-19 trading week. Please always give +- 1 candle for such extremes...
After that, if the index is in 6th rectangle, something negative should happen... the next multi-week pullback or correction cycle or a multi-month downtrend is expected to unfold once index starts to pass rectangle 6!
From this concludes:
==> This current running powerful bull cycle should run into January 2018, than rectangle 5 bull forces run out in time. There is hardly any doubt about that. Bulls are 99% safe into January 2018. Any dip/pullback/correction should be bought until December 2017.
==> Year 2017 should close near/at highs. I bet a burrito that Dow Jones will find its final 2017 High in course of last trading day of 2017!
Where are the price targets for this bull stampede into January 2018? Within my last Dow Jones forecast on 10-15-2017 (This US stock bull market remains unbelievably strong until about April 2018) I committed to myself that market with a + 95% odd at least will reach 24100 index points by April 2018 at the latest. Think actually that the 24100pts is very reasonable target for the expected important January 2018 bull market high:
Above is once again todays main topic. For the possible uptargets next let`s observe the bull at main targets in course of 2016/2017 and rectangles 3 and 4. "2016 Winter Break" was inspired by 2nd double arc resistance. Once 2nd was overcome automatically next higher double arc became next important uptarget for the bull run.
The Spring Low tested back a natural horizontal out of 2015 Low, afterwards the Dow Jones worked off the 3rd natural uptarget resistance magnet at Summer Top and rested for some weeks within "Summer Break" cycle.
After the "Summer Break" in one go the 3rd double arc and the Major Bull Market Resistance have been overcome. Major Bull Market Resistance is now Major Bull Market Support. The final upside break of 3rd activated the lower line of 4th double arc as next important bull market uptarget.
Well, because index trades now within rectangle 5, which is again a bullish backed one, index has +95% odds working off the lower line of 4th upmagnet resistance within current run. For mid-January 2018 lower line of 4th uptarget is at 24077.
==> We know that 24100 is very important bull market uptarget and upmagnet in the monthly scale and very, very attracting horizontal within dominating GUNNER24 Up Setup in the monthly, because of this I`m relatively sure that the Dow Jones is able to test and hit the 24100 until mid-January 2018.
But, index could exhaust higher! Of course... within bull cycle always the upper lines of the double arcs have been reached and tested, this allows and points to the outcome that this stampede will also test the upper line of 4th which runs at 24440pts for January 15-19 trading week! Yeah, Dow Jones even could reach and work off the upper horizontal range of rectangle 5 at 25440pts because the 5th rectangle is again a bullish one. But 25440 at upper end of rectangle 5 until mid-January 2018 is actually only a possible, theoretical goal. I think the index will cancel that target for later...
Enjoy and be prepared!
Eduard Altmann

