What happened on Friday is clearly showing signs of the very last eruption twitches of the last correction wave I supposed in the last Sunday issue, the C-wave. It’s a total sell-off in the precious metals and mines under high volume. Intraday some important monthly and weekly supports are breaking like thin boughs. There’s no, may it be ever so little intraday recovery move, let alone a rebound towards the close. Friday was a so-called trend day. The characteristics of a trend day are extraordinarily high spans, and the day falls – in case of a bearish trend day – virtually from the opening to the close closing near the lows. At the same time the deep sell-offs on a Friday get mightily down all the bulls – in psychological respect – because they make expect a bloody continuation for the next Monday/Tuesday and even for the entire next week.
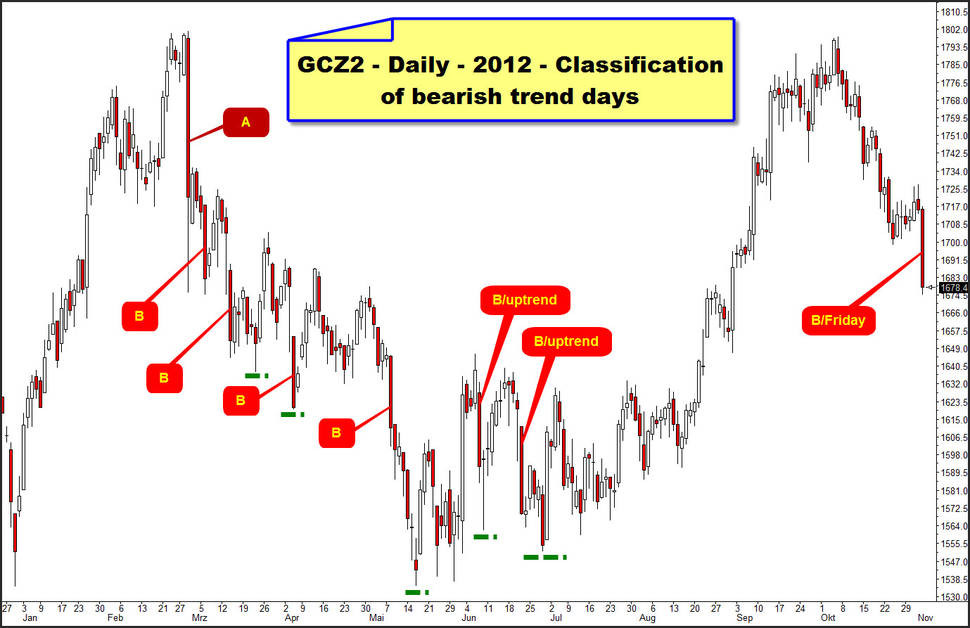
In gold the price span of Friday was about 42$. From the opening to the close Friday showed a decline of about 37$. Thus last Friday took its place in the typical performance of a bearish trend day class B:
In 2012 we’ve experienced exactly seven such B-events. So it’s a thoroughly rare copy of its species considering almost an entire year. And an A-event took place on 02/29… have a look at the 130$ span of that day to recognize why I call it an A-event. That A-day was the trigger of the whole down move until the May lows.
Considering the chart closely now, you’ll discover that a B-sell-off day always results in lower lows inevitably. Even in an uptrend a severe B-day event doesn’t mean that the final lows have been made. So some new lows are coming up. This C-wave isn’t finished yet, especially taking into consideration that the B-days on Fridays point to the probability of a continuation of the actual swing until the next week. After 5 out of 6 B-trend days and the A-day a little countertrend move was started the following day at the latest, mostly during 2-5 days…
Last Sunday I held out the prospect of the C-wave to happen on the 21st day of the correction at 1686$ being the ideal target in price and time. From my point of view it’s for certain that by virtue of the Friday performance under the timing aspect the C-wave lows haven’t been made, and on Friday the important monthly 1*1 Gann Angle support residing at 1686 for October and at 1690 for November (please click here… to find the derivation of this important support) was fallen below. That’s why it’s got to go to the lower level before the year-end rally can begin. That level is now between 1654 and 1659 in gold!
Watch out: Friday, 11/02 was the 21st day of the correction. It would be ideal now if – beginning with Monday – perhaps at 1672-1670 a two to three day countertrend starts, at most going to the 1698-1700, followed by another 2-3 day very last sell-off move that turns at 1654-1659 then. But IF on Monday 11/05 or on Tuesday very early the 1654-1659 were reached already that would be day # 22/23 of the correction being within the allowed period of time for the final C-wave low! Please expect the same for silver, as far as the count goes – see below.
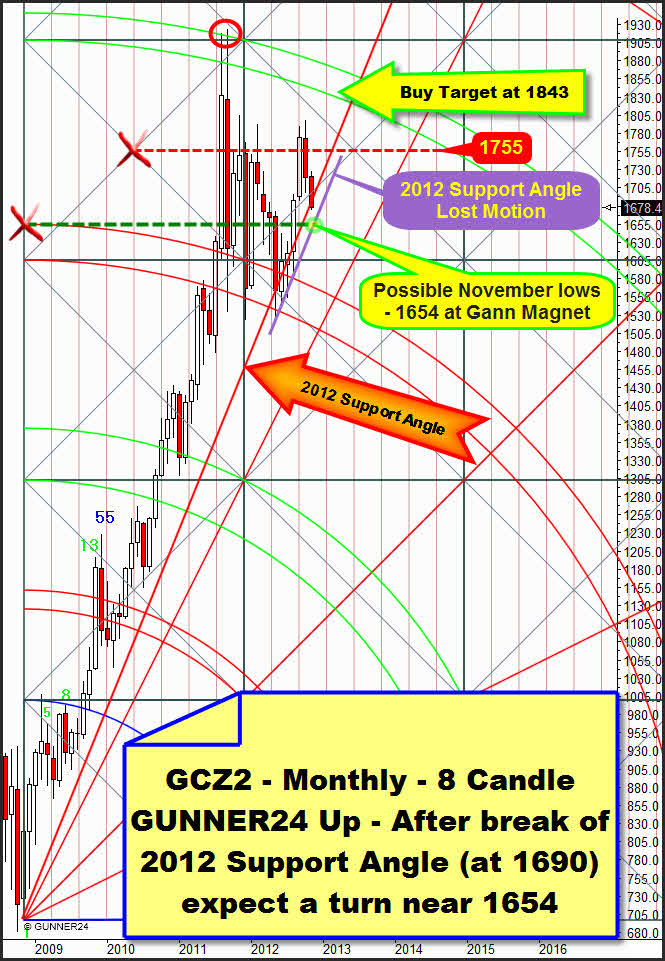
Starting point for finding the target of the possible C-wave low that is going to be made in November 2012 is the 2012 Support Gann Angle in the actual monthly 8 candle up setup.
The 2012 Support Gann Angle is backing gold on closing basis. No monthly close in 2012 has been below this important angle. The month with the lowest close in 2012 was May that closed exactly on the 2012 Support Gann Angle – and the support function of this angle started. It was also in May when the 2012 lows narrowly beneath the lower line of the 3rd were made. The 3rd is a strong support now. After all the rebound from it led to the September highs. At the May 2012 lows a new initial impulse started that lasted 5 months. Immediately you’ll see more on this new setup in the next chart…
It’s unambiguous and visible for all of us that since May the different months may fall below this 2012 support Gann Angle. The price has been oscillating around the angle…
The depth by which the angle may be fallen below is called the lost motion in Gann’s terms, made visible in the chart by the purple line. It has the same angle as the 2012 Support Angle but it is shifted parallel downwards. For November, at 1654 this lost motion of the 2012 Support Angle is crossing the important horizontal support that starts from the intersection point of the upper line of the 3rd with the beginning of the setup! At the moment it’s the strongest Gann Magnet underneath the 1690 area. Any daily close below 1670 and the 1654 are the possible target. But the C-wave being the decline may come to its end at 1659 already.
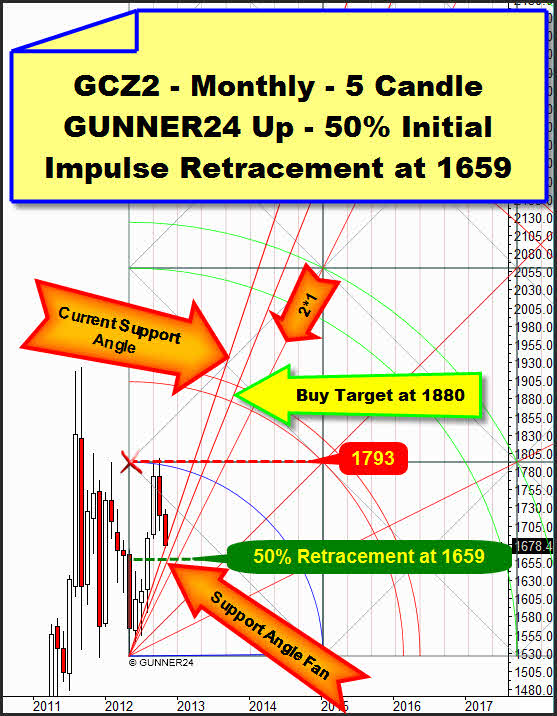
Let’s consider about this simply the 50% retracement of the last initial impulse. Clearly visible is the 5 month up impulse that started at the May lows ending in September. The October highs overshoot just narrowly the 5 month impulse. A new up impulse is to be applied because the lows were clearly made at an important double arc in the monthly 8 candle up. According to the rules we may apply new GUNNER24 Setups in the surroundings of an important double arc only if this one has a support (as in this case) or a resistance function respectively or if it is re-conquered by a trend-move or broken.
Well, from many reasons mentioned in the introduction, the 50% retracement is now the likely target of the C-wave. The 50% Fibonacci retracement level of the entire last up-move is passing at 1664$. In this case it differs but closely from the GUNNER24 Impulse Count because the overshooting absolute October high is used as a base for the calculation of the Fibonacci retracement. By contrast the GUNNER24 Method always tries just to capture and measure the broad movements of the masses that doesn’t have to accept responsibility for the overshooting of the September top by 8.10$ in October.
Next is silver:
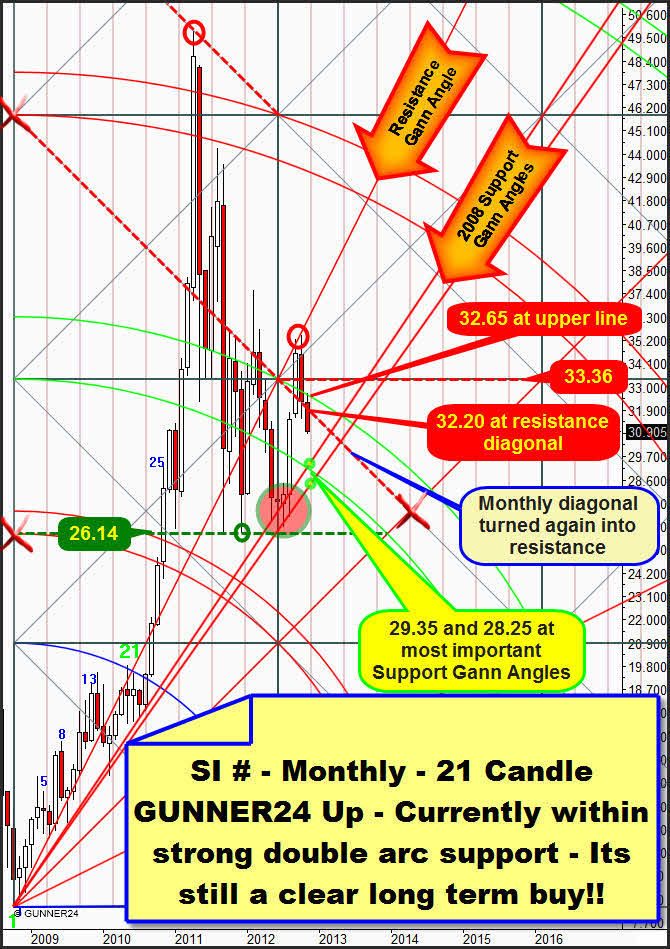
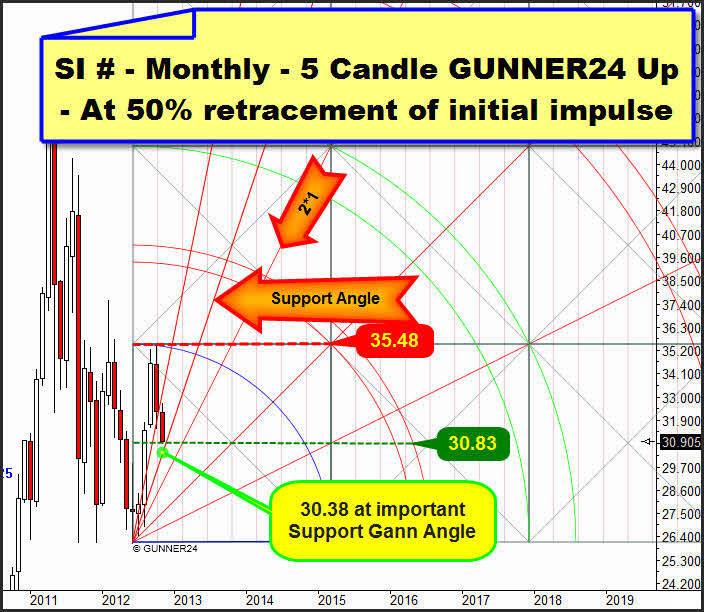
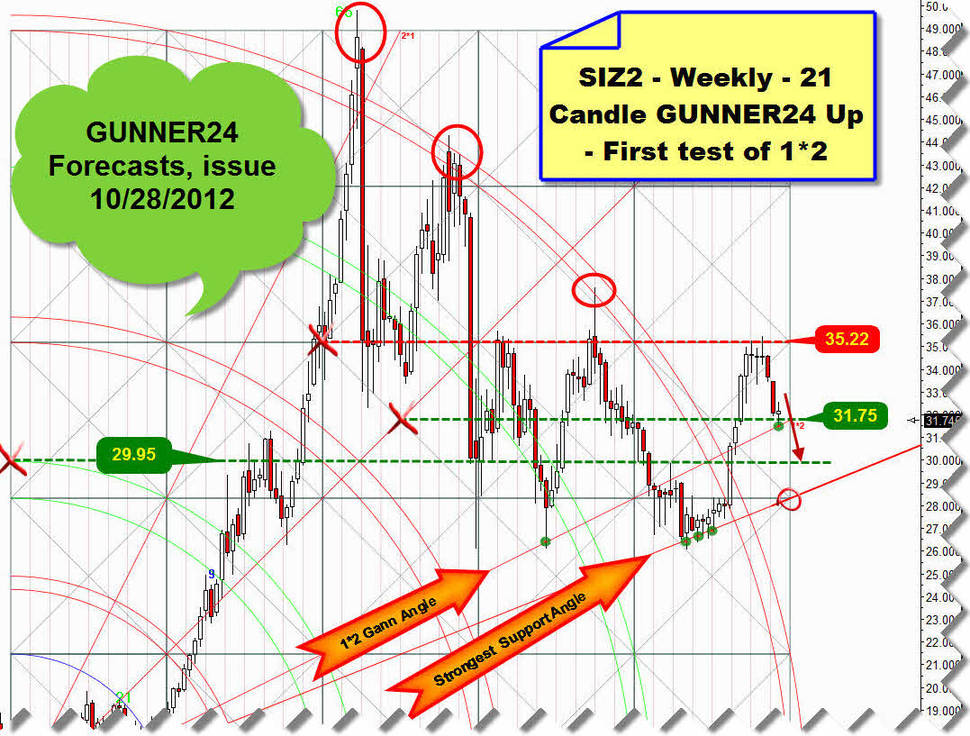
As always seen, silver is really a little bit less sharp to be forecast than gold is. After the Friday break of the important monthly support diagonal that passes at 32.20 for November, the important long-term monthly 21 candle up is now permitting very low down targets at both important 2008 Support Gann Angles – A) 29.35 and B) 28.25. These Gann Magnets are existing and now activated, but they are not very likely to work in consideration of the possible C-wave in gold that is not very far away. My tip is rather a final low between 30.35 and 29.95:
At 30.38 the next support Gann Angle in the actual monthly 5 Candle GUNNER24 that starts at the June 2012 lows. Here silver is parking as well at the 50% retracement level of the GUNNER24 Initial Impulse as at the 50% Fibonacci retracement. Since also in silver we can work on the assumption that some lower lows on daily basis shall happen this 50% retracement is not likely to hold.
The 29.95 horizonatal support is the strongest visible weekly magnet and the other possible turning point of this correction calculated as early as last week in case the 1*2 Gann Angle in the actual weekly 21 candle up on weekly basis falls. And that was the case last week. Here is again the weekly chart of last Sunday:
Now we’ll place buy limits for stacking our monthly positions. For gold it’s at 1657 and for silver at 30. Both orders MIT (market if touched). Both orders will be valid till 11/09/2012.
In these whipsaw markets of the last weeks that might confuse any trader thus leading mercilessly to burning the trading account the professional signals have got their special importance. You get them in the GUNNER24 Gold Trader!
You best register with our GUNNER24 Gold Trader now. That’s where we oversee the optimal entries and exits for you. Especially in the difficult market situations where many factors have to be considered the Gold Trader is backed by the additional GUNNER24 Signals based on the combined 1, 4 and 8 hour setups to catch the optimum entries and exits.
The GUNNER24 Gold Trader will provide you with the critical knowledge you need to forecast and analyse the precious metals with the GUNNER24 Forecasting Method. All the GUNNER24 Trading Signals you receive real-time are based on the actual Gold and Silver Future. The NEW GUNNER24 Gold Trader is a must for every actively working investor and trader who wants to trade successfully in everyday trading. The insights you receive from the head trader Eduard Altmann (and discoverer of the GUNNER24 Forecasting Method) are truly amazing sometimes. I promise!
Click the button below and order the GUNNER24 Gold Trader - $39.90 US a month. For 201 members and up - $49.90 US a month.
Be prepared!
Eduard Altmann

