Bigger perspective offers that the gold correction should at least reach and test 1422$, which is future MAJOR support and most attractive down magnet for the rest of 2019. Magnet is formed by now usually strong attracting important important Gann Angle out of 2015 Bear Market low and the for years known und mostly respected GUNNER24 Horizontal, which is directly connected to the 2011 alltime-high.
After year highs made, GUNNER24 expected the 1422$ work off sometimes in course of October 2019. Actually, much points to the outcome that 1422$ could be done mid-November. This is in sync with the time window the bitcoin cryptocurrency should bottom on intermediate base. For this view please re-read past week Sunday issue of the free GUNNER24 Forecasts "Come on, Bitcoin, make my day".
Corrections often are tricky to count, to measure and to forecast according price and time, cause they are always just counter swings within a bigger trend. Bulls are always lurking and hoping for the main trend continuation, bears battle for short-term oriented gains cause they know market is in corrective mode until proven otherwise.
Well, actually I have a total of 3! quite valid weekly down setups that can measure this correction and make sense. I will interpret these 3 for you right away. All 3 looking somehow plausible in their own way.
These alternately influence the current gold correction. Suddenly, the effects of one setup take over, then the other G24 Setup rules mostly, afterwards the third, or again the first, is main influencer of the corrective cycle. Or, sometimes 2 of these setups together influence the upcoming development. Depending on. Tricky and corrective right now, as mentioned.
But thankfully, at least the 2x confirmed main resistance of this correction is wonderfully clear to determine. And that's where you could sell-short gold until Friday...:
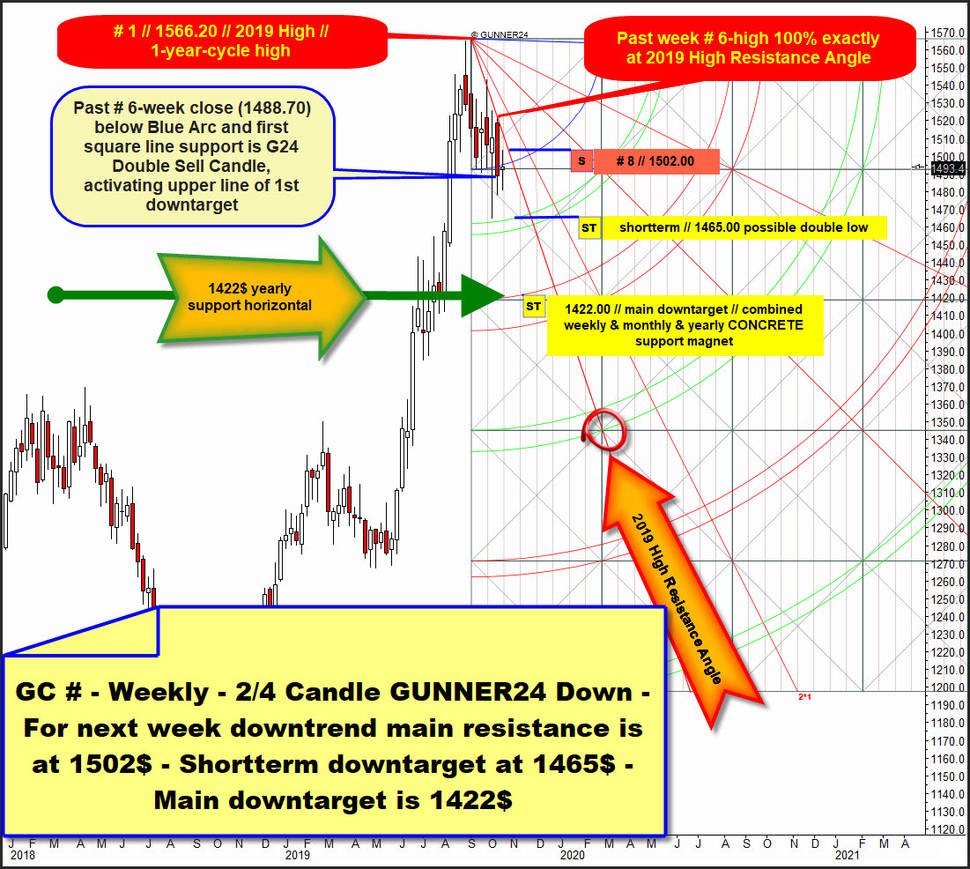
The first downtrend view is a weekly 2/4 Candle down setup, starting at # 1 // 2019 High what is with a +90% odd the FINAL high of 2019 and the final 1-year-cycle high:
2/4 means that lows of downtrend weeks 2 and 4 together form Blue Arc standing, from this the perhaps most important future items or magnets according time and price emerge.
In this setup case the Blue Arc is in nearly total harmony to first square line, so the items form a magnet under this gold closed for the very first time a week ago. This lowest weekly close of downtrend was a stronger chart-technical sell signal or at least a stronger downtrend continuation signal what offers lower downtrend lows will come true.
At past downtrend week # 6 the gold closed below Blue Arc/first square line support magnet and this fired also a GUNNER24 Double Sell signal on weekly base. # 6-close activated the test resp. work off of lower line of 1st double arc support in trend direction.
Interestingly this lower line of 1st support might be tested exactly at the same price as the current correction low, which stands 1465.00$ and is printed at bearish extreme of correction week No. 5. Remind, 5 is Fib number. The 5 time trigger is responsible for current downtrend lows!
==> the activated shortterm downtarget of the 2/4 weekly GUNNER24 Down is "the classic" backtest of 1465$, current downtrend low environment. A next test of 1465$ could come true towards end of the month.
1422$ CONCRETE support horizontal (as rising yearly important Gann Angle support out of 2015 Bear Low...) is in full sync to possibly coming/perhaps due 2nd double arc downtarget test.
Thus, the main target of above weekly 2/4 down setup stands at 1422$!
Best, cause most risk-less sell-short entry for the coming week is at 1502$. There and then runs 2019 High Resistance Angle for the coming correction week # 8.
Top of downtrend week #6 was all in all second negative test of naturally anchorable 2019 High Resistance Angle..., afterwards a double sell candle was triggered. 2019 High Resistance Angle actually acts as stronger resistance on yearly base and is best negative tested, and best confirmed resistance of the down cycle that started at 2019 Highs. And that`s why any occurring next test of 2019 High Resistance Angle should be sold until proven otherwise.
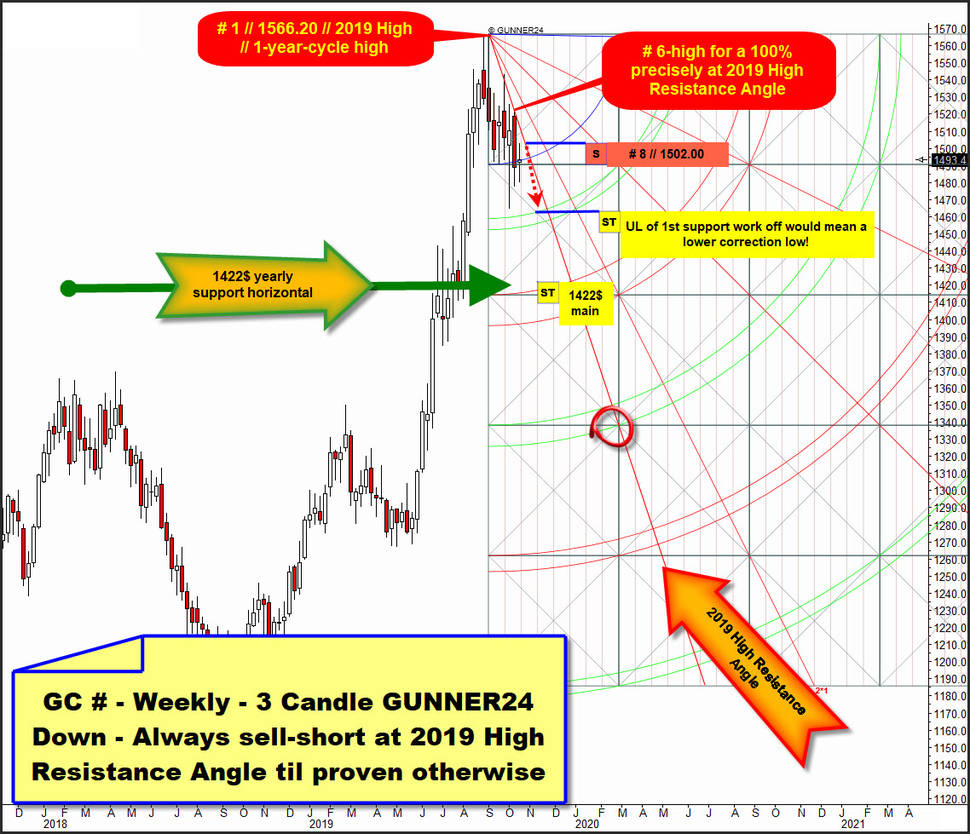
A next valid down setup is this 3 Candle down, starting at # 1 // 2019 High. 3 is Fib turn number...:
This setup looks valid because this week # 7-candle body is braked by Blue Arc, likely stronger weekly resistance and supported by the first square line which perhaps morphed to a kind of natural support on weekly base! And because this week # 7-close has defended perhaps stronger natural weekly horizontal support it might happen that gold in course of the week wants another test of well-confirmed falling 2019 High Resistance Angle!
Watch carefully above that # 6-close also within anchored 3 Candle down was below Blue Arc/first square line support magnet..., however, this sell-trigger magnet might be a weaker one or none important one cause gold bounced somhowe for the week!
A test of activated upper line of 1st double arc support/downmagnet in trend direction usually means a next lower downtrend low is on agenda for gold in course of the coming weeks.
==> Plausible view, cause the yellow metal usually should need the yearly 1422$ CONCRETE backtest before the start of a next stronger weekly upcycle should be allowed.
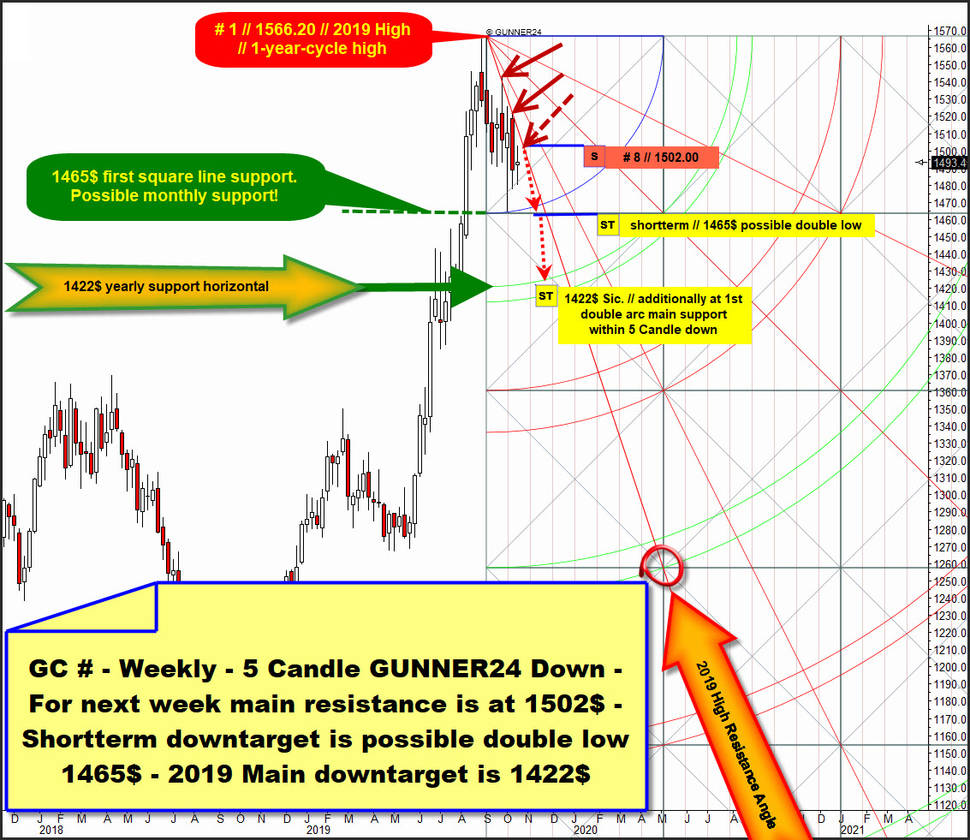
Last but not least this next one is also very important nailing coming developments, I suppose. It measures from 2019 High down to # 5-Fib number low, the current seen correction low:
Within this setup the natural Blue Arc support = downtarget and natural first square line support = downtarget unite at 1465$, what is in harmony to correction low and this is why the backtest of the 1465$ correction low is perhaps the strongest, most imminent attractive future magnet for a 1502$ short position and and possibly the deepest price the bears can achieve within this correction cycle.
==> Shortterm downtarget is the perhaps due exact backtest of 1465$ magnet which then A) might offer very strong combined weekly and monthly support and B) may be the support trigger for the next multi-week long uptrend which then might test back 1550$!
5 Candle GUNNER24 Down gives possible most attractive downtarget what seems to be the test and final work off of upper line of 1st in trend direction. Nicely this downmagnet support is in 100% sync to the yearly 1422$ GUNNER24 CONCRETE Support.
Sic!: 1422$ is most logical main downtarget of this weekly correction cycle.
The very first weekly close under 1465$ current correction low within next 1 to 4 weeks is the next very strong weekly sell signal and at same time downtrend continuation signal, therewith recommending the quick and necessary work off of 1422$ main correction target!
You best register with our GUNNER24 Gold Trader now. That’s where we oversee the optimal entries and exits for you. Especially in the difficult market situations where many factors have to be considered the Gold Trader is backed by the additional GUNNER24 Signals based on the combined 1, 4 and 8 hour setups to catch the optimum entries and exits.
The GUNNER24 Gold Trader will provide you with the critical knowledge you need to forecast and analyse the precious metals with the GUNNER24 Forecasting Method. All the GUNNER24 Trading Signals you receive real-time are based on the actual Gold and Silver Future. The NEW GUNNER24 Gold Trader is a must for every actively working investor and trader who wants to trade successfully in everyday trading. The insights you receive from the head trader Eduard Altmann (and discoverer of the GUNNER24 Forecasting Method) are truly amazing sometimes. I promise!
Click the button below and order the GUNNER24 Gold Trader - $39.90 US a month. For 201 members and up - $49.90 US a month.
Be prepared!
Eduard Altmann


