Now, the three US stock market majors we track – S&P 500, NASDAQ-100 and Dow Jones – were caught as well, after all. The 10-15% correction in the bull market, due and expected in 2014, has begun - again in October…
Using the example of the S&P 500, I’m going to show up today the rather likely correction course in terms of price and time.
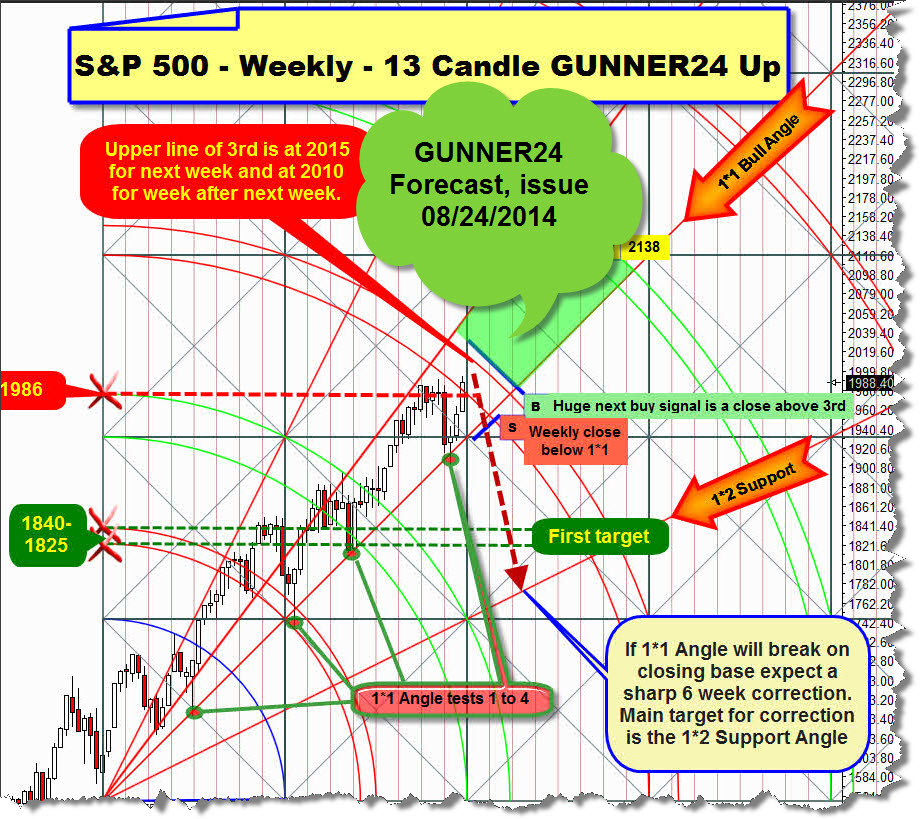
The sharp correction - I mean pretty fast and deep – was to start respectively be rung in in case the important 1*1 Bull Angle breaks on closing base at the next test of the market. And in case the break through the 1*1 succeeds, the 1*2 Support Angle and concerning the time factor a correction phase during six week were identified respectively assumed as price target for the correction:
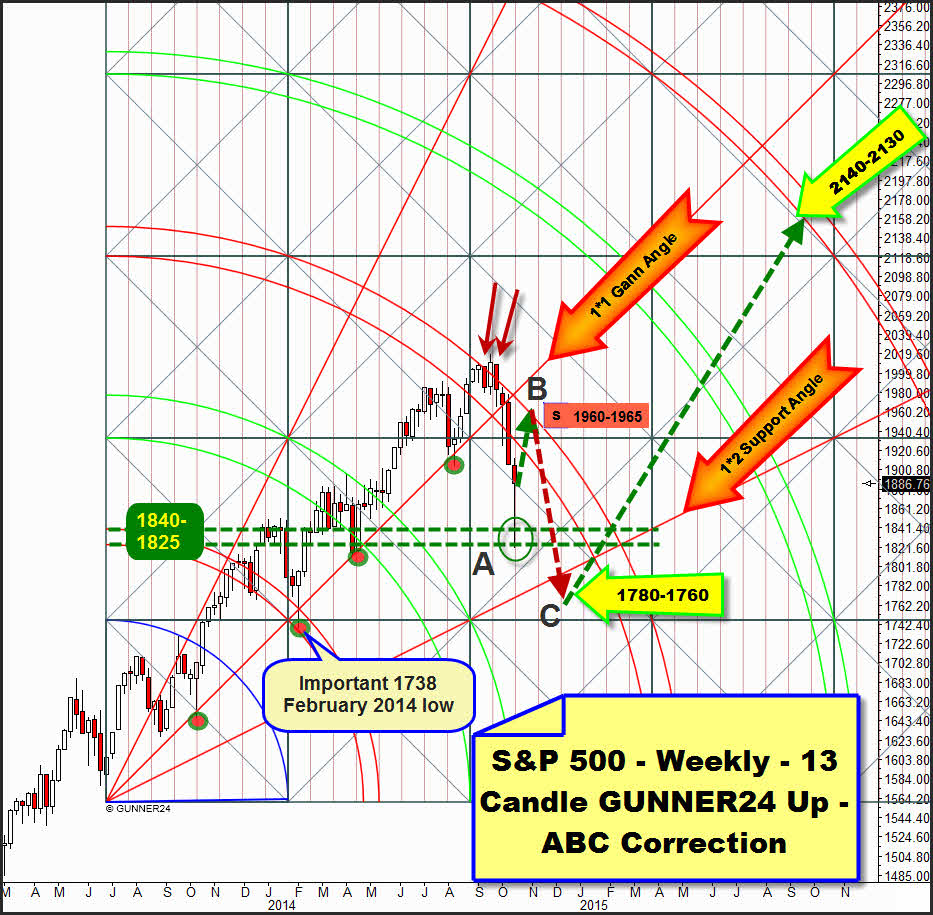
Within the free forecasts of 08/24/2014, an important top at the upper line of the 3rd double arc was supposed to occur in the price range between 2015 and 2010. Finally, the top is at 2019.26, you know. Afterwards, the market was supposed to start declining. As first target for the correction, the horizontal support area between 1840-1825 was identified. The first important down wave, the A, bottomed out last Wednesday at 1820.66. Since then, the S&P 500 is in its B wave that is likely to lead it back to the important resistance of the 3rd double arc in the currently valid 13 candle up on weekly base. Here’s the present reading of the weekly setup regarding ABC wave targets:
The 6 week correction was to be sold if the 1*1 Gann Angle breaks finally. At the altogether 5th test, the important bull support in the weekly time frame broke. Thereby, the next lower important Gann Angle below the 1*1 Bull Angle is activated as correction target. It’s the matter of the 1*2 Support Angle. There, at the 1*2 Support Angle and in the range between 1780 and 1760, the C wave is supposed to end.
It’s the second week now that the S&P 500 has been trading below the 1*1 Bull Angle having finished the wave A at 1820.66. 2 weeks down. That gives us a clue how long the B wave might/should have to last: Likewise 2 week candles. Within these two next candles, within the B wave the ruling resistance of the upper line of the 3rd is likely to be reached before the market falls into the 1*2 Support Angle for 2 more weeks in order to work off its correction target then. Thus, the B wave is supposed to top out in the range between 1965 and 1960 within the next 10 trading days. It’s another ideal short-opportunity! SL is a weekly close above 1980 till mid-December. For, such a high close above the 3rd double arc would mean that the 1820.66 will have been the final low of the entire correction!
But technically, it’s the final low of the C wave where the general trend is supposed to be resumed from again – in order to work off the 4th double arc and the Major Top of this bull at 2140-2130 until the fall of 2015.
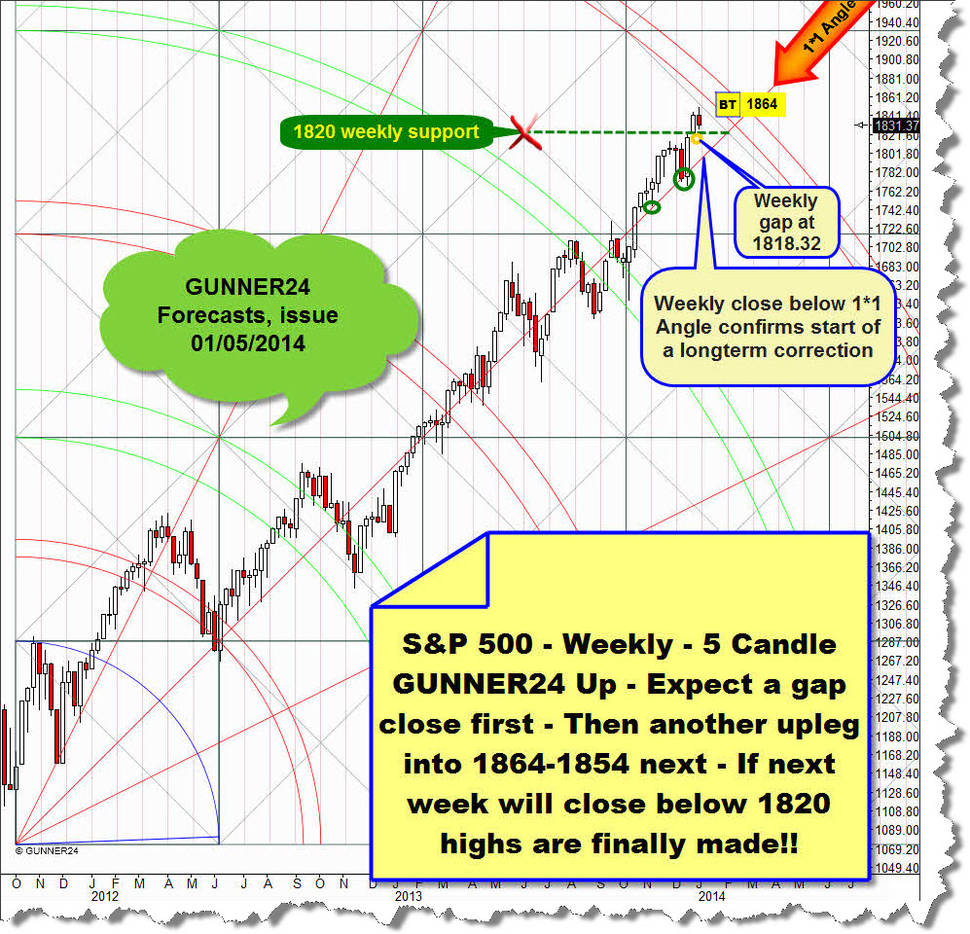
In respect of the A wave, I am positive at a 99% that this first important correction target will finally be worked off at 1820.66 the market now being in its B wave already. At the one hand, the 13 candle up setup above is delivering strong horizontal support between 1840 and 1825. On the other hand, a further important weekly up setup is putting out the 1820 as major horizontal support:
This is the matter of an up setup we utilized for a long time in 2012 and 2013 till the beginning of 2014 to assess the market. It’s this 5 candle up that works on the assumption of an extremely important final year-low 2011, an important low of the current bull. The 1820 can be derived directly from the absolute 2011 year-low as important horizontal support. The 1820 are thereby an extremely important and extremely strong support. ==> Please mind about this also the GUNNER24 Forecasts of 01/05/2014.
Since the week closed quite clearly above the 1820 and furthermore, starting from the 1820 support, with a very long lower wick – evidence that always points to enormous buying interest as important support has to be present at the low environment – technically the S&P 500 cannot be anywhere else but in its B wave up! The B wave top is likely to be marked at the next higher important and currently determining upper line of the 3rd double arc resistance…
From there, the S&P 500 is supposed to fall fast and deep, namely into the 1780-1760 surroundings. The final break of the 1820 is expected to make the downtrend accelerate extremely! Thus, 1780-1760 is the down objective in the weekly time frame that is confirmed completely by an important support in the monthly time frame.
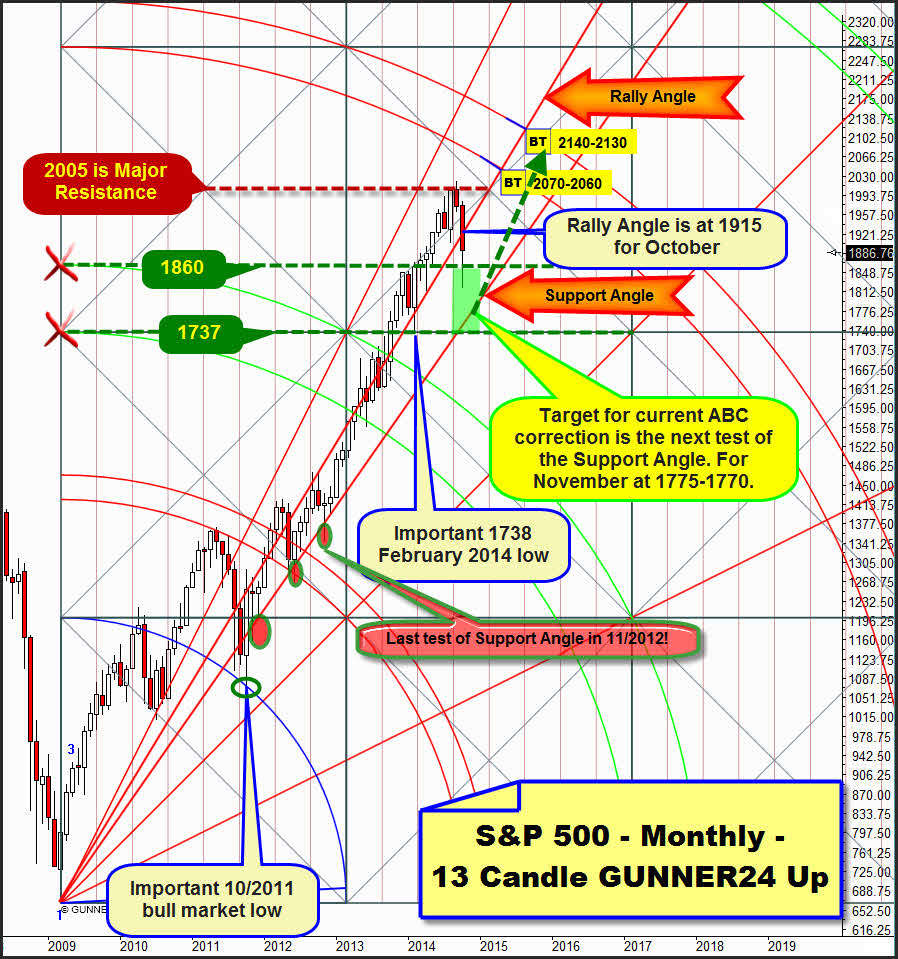
The 13 candle monthly up reveals that for November 2014 a dominating monthly Support Gann Angle is taking its course at 1775-1770.
At present, this is the strongest magnet below the current level. The Support Angle was formed because first the October candle of the year 2011 could clearly overcome this angle taking place several unequivocally identifiable tests of the angle over the years. The last test of this important support angle was in November 2012 – red/green ovals. Well, I think that precisely two years later, thoroughly detectable is a temporal symmetry that allows respectively enforces the new test of this Support Angle for November 2014…
During the past tests of this Support Angle really every time it came to a penetration of the angle. So, at the next test and in case this one takes place in November 2014 indeed 15-20 index points beneath the 1775-1770 will have to be reckoned with… by all means the 1750 area is thereby a possible November low.
Here is where I last expressed my assessment on the Rally Angle.
Well, the Rally Angle is at 1915 for the present October, after all. So, if the evaluation of the B wave to keep on lasting 10 more trading days is respectively comes true, the Rally Angle will be supposed to hold again because October is likely to manage closing above. If October doesn’t succeed in closing obove the 2015, a touch with the Support Angle will be compelling as early as in November with nearly a 100% of probability.
If in October 2014 the Rally Angle is newly defended on closing base, the 1820.66 will have the opportunity of turning out to be the final low of the whole correction… I rather expect the 1820 to fall in the course of the C wave however, because the Support Angle in the chart above should technically be the dominant magnet now. I.e., this angle is actually considered to emit a strong force of attraction. That anon would have to signify falling prices until it is worked off.
Between 1860 and 1737 there is an important and strong horizontal monthly support area starting from the intersection points of both lines of the 2nd double arc with the beginning of the setup. At any price within the strong horizontal support zone, the correction will technically be expected to come to an end.
At 1737, in February the important year-low 2014 was made. Actually, the 02/2014 low should not be headed for respectively tested in the current correction. That means, this correction must be finished between 1780 and 1750, with an 80% of probability. Nevertheless, at a weekly close below 1750 the 1737 will be reached and worked off, consecutively at least the round 1700 being tested. At the moment, I don’t see such an outcome however. That is why this is the wrong place and the wrong time to upset the apple cart.
Be a part of our exclusive sworn GUNNER24 Trader Community – now…
- with daily trades – quick, safe and profitable…
- in well-chosen precious metals, commodities, indexes, currencies and in the best stocks worldwide...
- in both rising and falling markets…
- with little use of capital…
Be prepared!
Eduard Altmann


