Due to my vacation break, several weeks have passed by now since the last analysis on the precious-metal and equities environment in the free area.
Today, by reference to the core markets gold and S&P 500, I’d like to go into the foreseeable swings of the coming couple of weeks.
On 09/27/2015, inter alia I stated in the free GUNNER24 Forecasts that for the S&P 500 index a final correction low was expected to occur in the week of October 5-9 at 1860 resp. 1840-1820. Indeed, the market turned upwards from a small higher 1871.90 correction low attained on 09/29.
1200$ is minimum countertrend uptarget according to price and time... Yet the current countertrend is very likely to be forced to run out at/near the 1223$-GUNNER24 Horizontal Resistance Magnet at the end of 2015/January 2016.
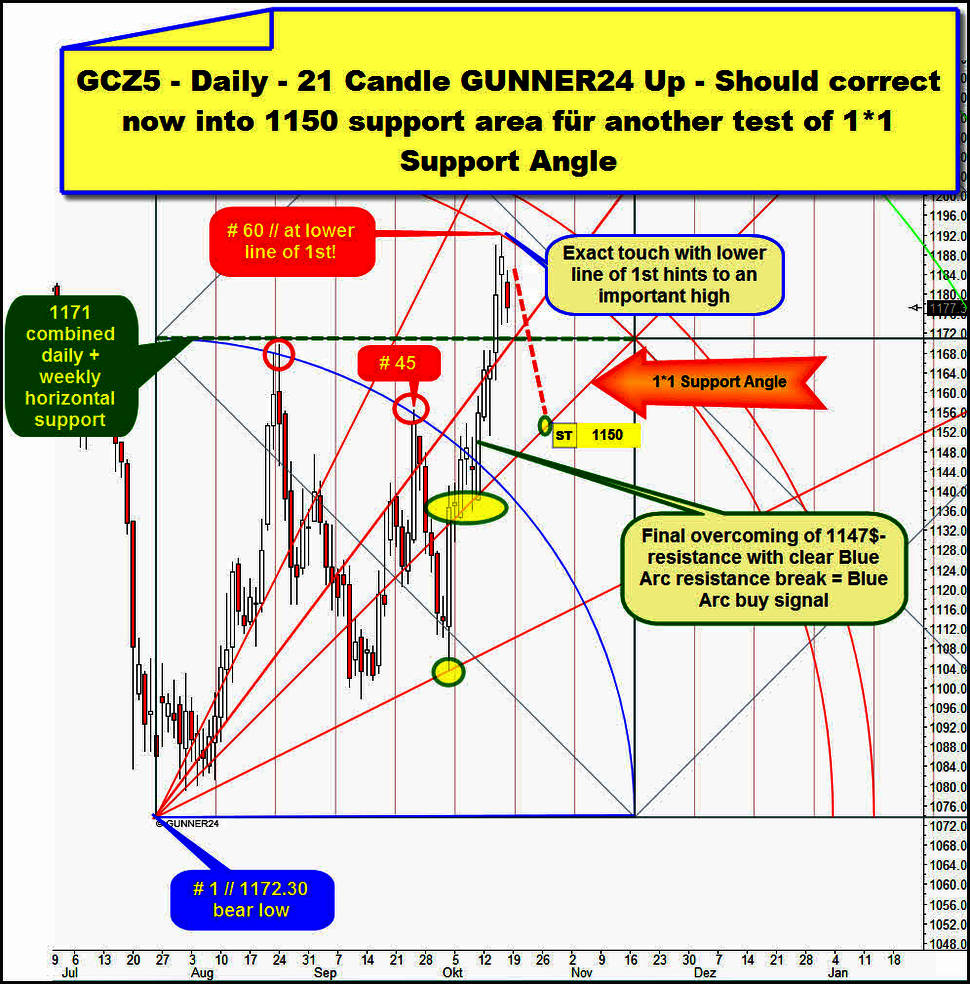
Ultimately, gold took the 1147$ hurdle on closing base finally on Friday of the trading week before last, with this simultaneous Blue Arc buy signal in the important 21 Candle GUNNER24 Up in the daily time frame unchecked popping up to the current course high at 1191.70$, reached last Thursday:
On the one hand, the Blue Arc resistance was defined by the very first up impulse comprising 21 candles, starting from the 1172.30$ bear low (# 1), and it was confirmed by the interim high of the current countertrend move (countertrend day # 45) as the main resistance in the daily time frame.
The day the 1147$ main resistance of the year 2015 and the Blue Arc resistance were finally overcome, as well the last test of the 1*1 Support Angle took place. This last touch/this last test of the 1*1 Angle was ultimately the trigger for the hard rally into the lower line of the 1st double arc ( high of # 60) resistance. The last test of the 1’1 Angle released enormous upwards forces...
These upwards forces were able to overcome the 1171$ first square line resistance without much ado. The 1171$ was not only daily resistance horizontal, but it is also consistent with an extremely important GUNNER24 Horizontal Pivot in monthly time frame that is directly derivable from the 1923.70$ all-time high. It is, by the way, just like the 1147$ main resistance of the year 2015 is. The derivation of these marks as well as several further important horizontal supports resp. horizontal resistances can be withdrawn from the free GUNNER24 Forecasts, issue 08/02/2015 „The importance of 1072.30 for Gold".
For the time being, the upswing topped out now exactly at its 60th day just at the lower line of the 1st resistance magnet. Being worked off the lower line of the 1st double arc at the swing high on Thursday followed by the reversal candle on Friday points to gold being wasted, flown into a correction phase now that has got the next test of the 1*1 Support Angle as its minimum target.
==> Technically, during the next 8-10 days gold will be supposed to correct downwards, in the process at least working off the 1*1 Support Angle at 1150$ to start then a new several week upwards leg into the minimum target of this countertrend at 1200$ resp. into the actual main target of this countertrend at 1223$.
If gold closes below 1140$ during the next 10 days, the 1122$-1125$ GUNNER24 Support Region within the now expectable 8-10 day downswing should have to be reached!
I think that gold is facing "just a correction in the up-bounce", followed by another up leg that is supposed to bring along some higher countertrend highs, at the latest in the month of November.
But yet – as to my experience – working off the lower line of the 1st that precisely, followed by a reverse candle on Friday seems a little ominous. Such a signal combination in the daily time frame together with the recognitions in the weekly chart – watch next chart below – would allow the whole countertrend since the August bear low come to an end with the Thursday high pushing gold to verge on new lower bear lows – as early as in the further course of the year 2015.
Hmm, an attack to the existing bear low or the 1122$-1125$ support region or even the round 1100$ mark seems to be arranged respectively eyed somehow by the Commercials (Banks and Producers) as well.
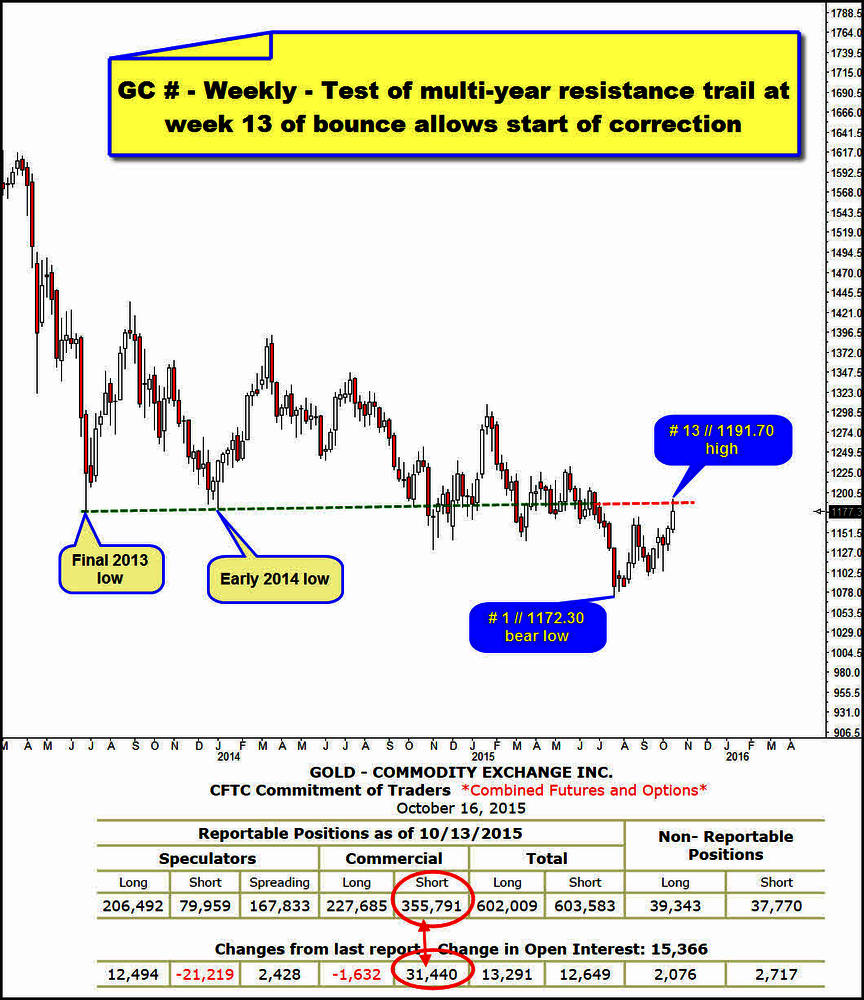
The elevation of their short-positions in the course of last two weeks is blatantly striking. Yeah, it’s honestly fatal for all the gold and silver and miners bugs that since the August 2015 bear lows mostly bank on a new bull market to start:
Wow, just look at the shifting towards the shorts by the Commercials in the last recorded week of the COT report from 10/07-10/13. That’s gnarly negative. Besides, we can be pretty sure that the Commercials have raised again their short-positions since last Tuesday (10/13) in order to satisfy the long-requirements of the speculators (Hedge Funds). For on 10/14 the 1172$-GUNNER24 Horizontal Pivot was taken upwards releasing a little buying frenzy that led up to the multi-year resistance trail identifiable in the weekly chart of the COT report above – to the 1190$.
The multi-year resistance trail has its anchor points at the final low of the year 2013 and the early 2014 low. It was decisively broken downwards in July 2015 at the beginning of the last sell-off leg, so it morphed into strong future resistance.
By reaching this multi-year resistance trail after 13 weeks of bouncing (Fib numbers use to signal changes) and by its very first backtest and by the extremely high short-positioning of the Commercials, obviously there is at least a suggestion resp. rather clear evidence that an important countertrend high at 1191.70$ was attained on Thursday… in addition strongly advising that a correction is due to follow now.
==> I’m working on the assumption that gold is going to and will have to correct rather for two weeks than for one. In case of a two week correction, the weekly countertrend would be in week # 15. From the low (1150$ environment resp. at most from 1122$-1125$ monthly horizontal support) of the 15th/16th week of the countertrend, gold should have to start rising again to form its final top around the 21st/22nd week of the countertrend.
The final countertrend top should be expected around the 1223$-GUNNER24 Horizontal Pivot. Then sally to new bear market lows and the round 1000$ – this round Gann Number will have to be worked off in this bear market!!!!! – and subsequently the new 800$-GUNNER24 Target Region of the bear market will be worked off till mid-2016.
=================
In my opinion, the odds of the US stock markets to complete their corrections in the overall bull market are now far higher than an 80%. Correspondingly, till year end 2015 – at the latest – I expect the existing US stock market all-time highs to be attacked.
New strong GUNNER24 Buy Signals in the weekly time frame for the S&P 500 during the last two weeks:
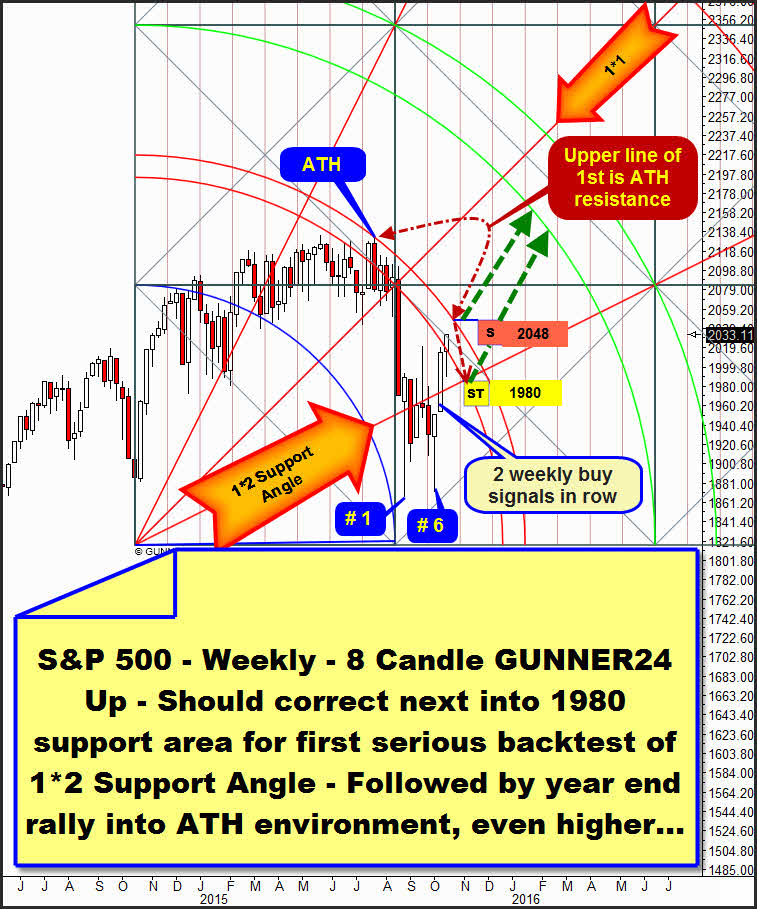
Above the currently dominating GUNNER24 Setup in the weekly time frame. It concerns the several times presented and analyzed 8 Candle up that is applied at the important October 2014 low.
Today, I begin my analysis at the all-time high = ATH. It was marked by the end of July, exactly at the upper line of the 1st double arc resistance.
==> So please note: The upper line of the 1st double arc is extremely important resistance for the index, since this is where the ATH was made.
==> The upper line of the 1st double arc is currently ATH resistance and additionally the most important resistance for the rest of the year 2015, above the current price levels!
At the upper line of the 1st double arc is where in July the correction in the daily + weekly + monthly time frames began. The correction conducted itself rather faintly for 4 weeks, then smashing completely after ultimately the 1*1 Angle was pulverized downwards, after all. The correction first bottomed in August at # 1 producing an important higher correction low at # 6. By the way, at the low of # 6 is a new initial weekly up impulse starts, so coming week is the 4th week of an new up impulse in weekly time frame!
The last candle is matter of the 8th candle since the correction low was reached, and since last week closed at the highs, # 9 will let follow a higher swing high for sure.
Week # 7 was able to re-conquer the 1*2 Support Angle with a mighty uptrend candle. This was the first mentioned weekly GUNNER24 Buy Signal.
The last candle was able to overcome the lower line of the 1st double arc resistance on weekly closing base unequivocally. This is the second consecutive GUNNER24 Buy Signal in the weekly time frame!!
==> By the lower line of the 1st being overcome, the upper line of the 1st double arc is activated as next important weekly uptarget. Thus, in the course of next week, the market is really supposed to meet its ruling ATH resistance and thereby the next strong resistance in operating range. At the very latest, the week after next will want to touch the ATH. This is what I think…
The ATH resistance will take its course at 2049-2050 next week! Of course, a short-attempt is advisable there, since the next touch with the upper line of the 1st double arc will be just the second touch/test with this resistance magnet, and technically, the second tests at important magnets are virtually always rejected. We shouldn’t reckon with the final break of an important magnet before its third resp. fourth test.
Ergo, the current swing is supposed to finish at 2049-2050 for the time being, the market beginning to correct from there on. The most logical first downtarget after the 2049-2050 ATH resistance is reached, will be a first serious backtest of the 1*2 Support Angle at 1980 that was taken upwards two weeks ago!
If the index succeeds in closing above the 2049-2050 ATH resistance as early as next week, wow, in that case the current rally will be able to reach the all-time highs till mid-November already!
==> Technically, the final break through the important and strong 1st double arc resistance shouldn’t succeed before the course of the month of November 2015 however. By all means, a very first weekly close above the 1st double arc during the next weeks will be a new strong GUNNER24 Buy Signal in the weekly time frame.
==> If the upper line of 1st double arc resistance succeeds in being overcome within the NEXT 5 WEEKS – technically this is to be expected – the market and the other important US stock indexes will have to aim at their current all-time highs/2015 highs till the end of the year.
Be prepared!
Eduard Altmann


