Last week the markets changed from the consolidation into the correction mode. Unambiguously the decline of the last weeks is just a question of a correction within strong uptrends. Volume and impulsive momentum are clearly lacking, so the actual downswings can impossibly be considered as changes in trend! In addition the relevant GUNNER Up Setups show that the actual corrections are just a matter of the test of some important breakout levels that were clearly taken in September wanting now to be re-tested.
The question is now where and when the correction lows will have to be expected? Let’s first have a look at the US stock markets, especially the S&P 500.
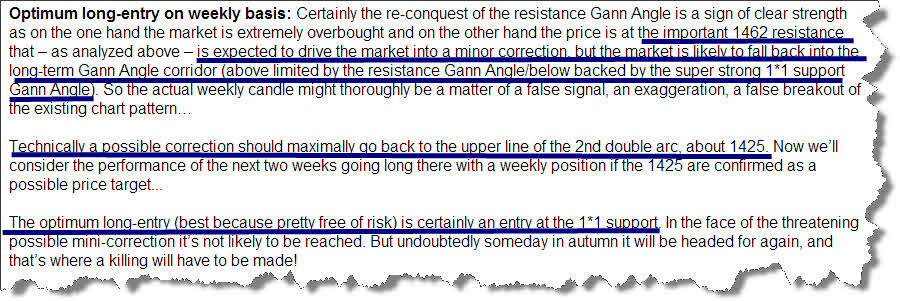
In the medium-term time frame, the weekly one, because of the extremely overbought conditions a month ago I thoroughly expected a minor correction until the 1420-1425 area we would have had to buy then:
At that moment, related to a promising long-entry on weekly basis I furthermore analyzed as follows:
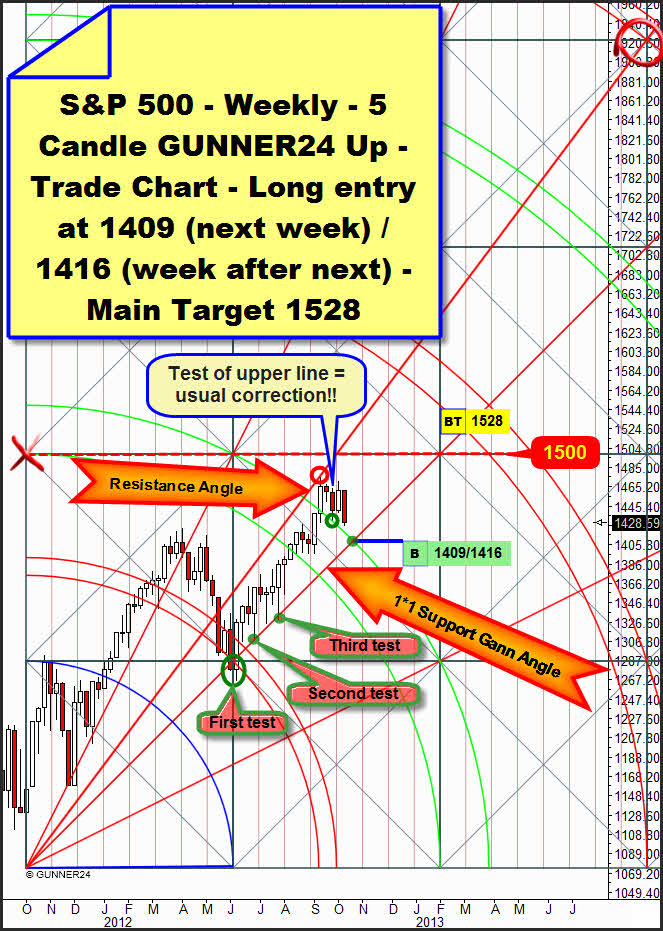
The important and optimal long-entry in the weekly time frame – the 1*1 Gann Angle – is now in impact distance. See here the actual weekly 5 Candle GUNNER24 Up Setup on the Friday close:
By the middle of September the high of the last up-wave was marked at 1474.51 points exactly at the new resistance Gann Angle anchored right above in the setup. Red circle. As many as four weeks the market has been correcting from this high. We may suppose that the final correction will take place in the 5th week of this correction. That’s next week. As mentioned in the introduction above, the four candles of the current correction don’t develop any life of their own, it’s rather dribbling down.
On the tide of the last upswing the important resistance of the 2nd double arc was clearly broken upwards. Now the actual correction is only just testing back this breakout level. Those facts were becoming well visible when the low of the weekly candle before last touched the upper line of the 2nd at 1430.53. Green circle. The candles trading ABOVE the 2nd double arc following well-ordered downwards without dipping into the 2nd. That’s a clear sign of a normal correction within an uptrend.
As supposed for a certain time, the actual correction should end with the 4th test of the enormously strong 1*1 support Gann Angle. We’ll buy every touch with the 1*1 magnet since from there a new rebound is supposed to happen that should represent the beginning of the next upleg. Target and end of the upmove that started in March 2009 keep being 1528 index points until February 2013.
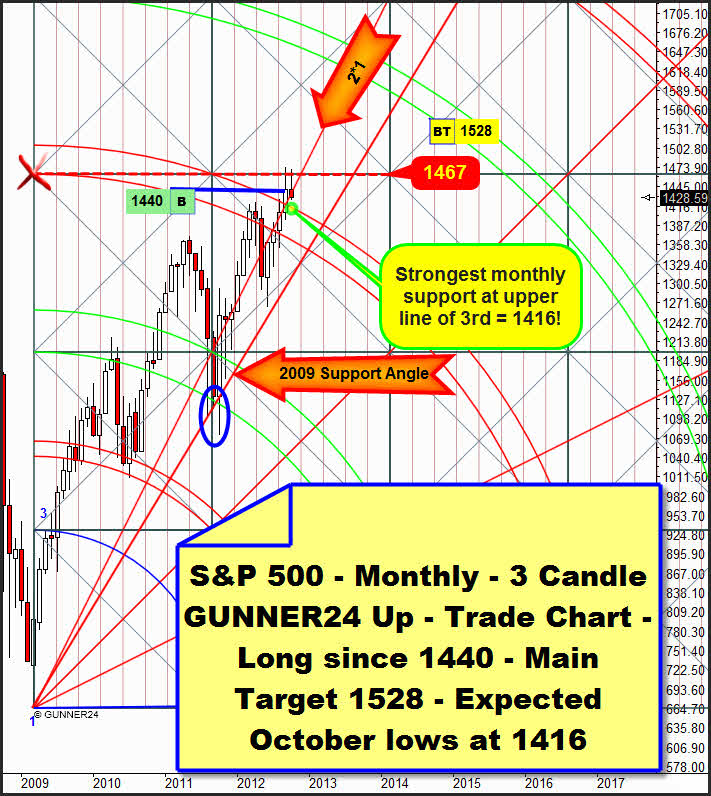
For next week our long-entry is at the 1* support angle at 1409, for the week after next it will be at 1416 (both orders MIT – market if touched, no stop-loss). This target sphere is representing the presumable change mark, not only in the weekly but also in the monthly time frame:
You may retrace extensively the last detailed analysis on the monthly time frame in the GUNNER24 Forecasts of 09/30/2012. A test of the upper line of the 3rd double arc at 1416 is very likely now. A brief dip underneath this 1416 point support is allowed of course, and it wouldn’t dilute the strong support function of the upper line. The lower line of the 3rd in the monthly time frame wouldn’t be activated before a daily close below 1395 points. Such an outcome is very unlikely to happen however because the September candle is showing a double buy candle.
In one step the upper line of the 3rd was broken upwards AND simultaneously the 2*1 Gann Angle was also re-conquered. It’s actually impossible that such a strong monthly buy signal would be denied!
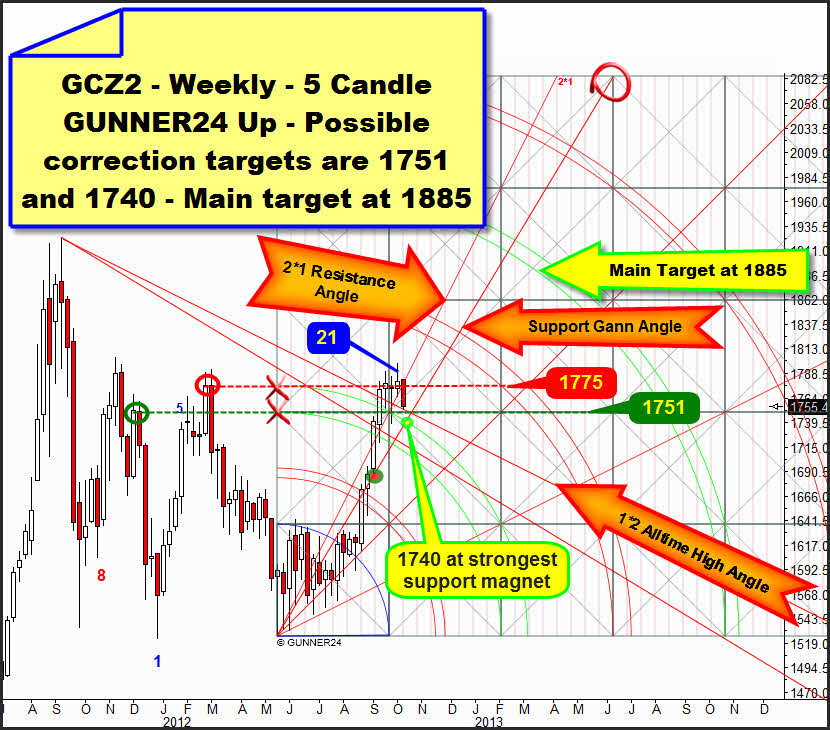
Gold, too, is now clearly showing the signs of a well-ordered correction above an important support double arc in the weekly time frame:
Also in the actually most important gold setup the candles of several September weeks are displaying different buy signals. The strongest buy signal was the final break of the 2nd double arc, of course. This performance activated the 3rd double arc as the next important up target. The main target of this weekly setup is the 4th double arc at 1885. At the same time, by the same week the weekly 1*2 Gann Angle that started from the all-time high was broken upwards = a double buy candle!
Some further, weaker buy signals are present since the horizontal resistance at 1775 that starts from the upper line of the 2nd was overcome twice already on closing base. Well, last week rang in a probably pretty short countertrend. Clearly visible is the first bold red candle since almost two months. The actual weekle close below the 2*1 Gann Angle makes it become a resistance angle that can’t ever be re-conquered. The countertrend is technically expected to last two or at the most three weeks. So maybe as early as next week the final countertrend low will be marked.
Hot candidates for the final countertrend low are 1751 and 1740.
Altogether as many as five times, gold closed above the 1*2 Gann Angle that started from the all-time high. That fact should technically keep this angle on weekly closing base. Technically it will take a weekly close below 1745 to break this angle pretty surely downwards, considering the lost motion. Target in that case would be the 1725 area within both lines of the 2nd double arc.
Next week this 1*2 all-time high angle will pass through the horizontal support at 1751. I.e. we are shown a strong magnet that will be reached IN ANY CASE!
For next week, narrowly beneath the 1751 there is another important weekly time and price magnet that is formed by the upper line of the 2nd and the strong support Gann Angle at 1740. The 1740 should be expected for next week if a daily close below 1748 is produced. But it’s also possible that just a short intraday dip to the 1740 will happen – being ticked off the test of the upper line of the 2nd as it were – before from there the next up-move towards the 3rd double arc in the set above will start.
In summary at 1751 the area of the strongest weekly and monthly supports begins. This support area ends at about 1700, the lower line of the 2nd double arc in the weekly setup above. At 1751 and at 1740 strong turns or the end of the countertrend respectively are expected to happen for next week.
If gold reaches 1751 by the beginning of next week silver will simultaneously be supposed to trade at the beginning of its monster monthly support area:
From 33.36 on silver (it closed at 33.475 on Friday) combined with gold may turn sharply upwards! Please read up again the detailed silver analysis of 09/30. You don’t want to miss a present, do you?
Would you too, like to profit from the next possible monster-wave in gold and silver on a large scale? Do you require a service that monitors, controls, anylyzes and signals for you all the important moves in gold and silver? If so, go ahead and order just right now the GUNNER24 Gold Trader!..
The GUNNER24 Gold Trader will provide you with the critical knowledge you need to forecast and analyse the precious metals with the GUNNER24 Forecasting Method. All the GUNNER24 Trading Signals you receive real-time are based on the actual Gold and Silver Future. The NEW GUNNER24 Gold Trader is a must for every actively working investor and trader who wants to trade successfully in everyday trading. The insights you receive from the head trader Eduard Altmann (and discoverer of the GUNNER24 Forecasting Method) are truly amazing sometimes. I promise!
Click the button below and order the GUNNER24 Gold Trader - $39.90 US a month. For 201 members and up - $49.90 US a month.
Be prepared!
Eduard Altmann


