Actually, there can be no better entry date in Gold and Silver Stocks than now.
Please start to accumulate Gold and Silver Miners! The Miners are now expected to rise steadily into December-January 2018, with the final high of 2017 having to be printed in the course of December!
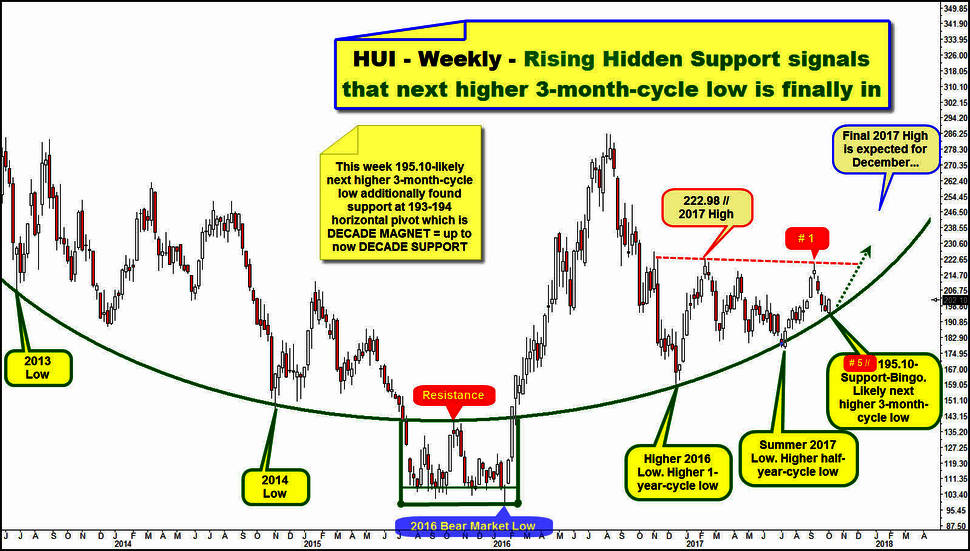
When it comes to analyze the Gold Miners I like best doing it by means of the HUI (NYSE Arca Gold BUGS INDEX). And the HUI now clearly signals that the recent correction bottomed finally after a "classic" 5-week down cycle at this week low which likely is the NEXT HIGHER 3-month-cycle low.
At 195.10pts week low, the market started to reverse at extremely important, strong, hidden support:
Above is HUI in the weekly chart, starting 2013. Hidden HUI Support is highlighted in fat-dark-green, this support is confirmed elliptical support in the yearly time frame, responsible for braking the HUI at the final lows of the years 2013 + 2014. In the final stage of the last bear market the elliptical trail was important, obvious negative tested resistance threshold.
After the then upwards sloping elliptical trail was recaptured at the beginning of the 2016 bull market the elliptical support was successfully tested back at the higher year 2016 low (December) which was the final higher 1-year-cycle low.
Next important higher bull market low triggered by elliptical support trail is 2017 summer doldrums low. This was higher 6-month cycle low (early-July) compared to important December 2016 higher bull market low.
Now the HUI once again made a touchdown into upwards sloping elliptical trail and obviously the elliptical support is able to release renewed upwards forces because this week fired a bullish reversal candle and that in turn implies:
A) Recent correction cycle which began at # 1, falling red-dotted weekly 2017 resistance bottomed at yearly elliptical support after a classic 5-week Fib number down leg.
B) The rising elliptical support appears again to trigger an intermediate higher low in the bull market, which is probably a higher 3-month-cycle low!
C) Lounch! = With a high probability a new multi-week upcycle was triggered at this week 195.10pts low.
CA) Usually the likely started weekly upcycle will test - at least - the falling red-dotted weekly 2017 resistance!
CB) Because after the almost usual September-October weakness the November to December time period tends to be always the strongest in the trading year for the Gold and Silver Mining Stocks, the HUI now has high odd to find its year`s high in the course of December 2017!
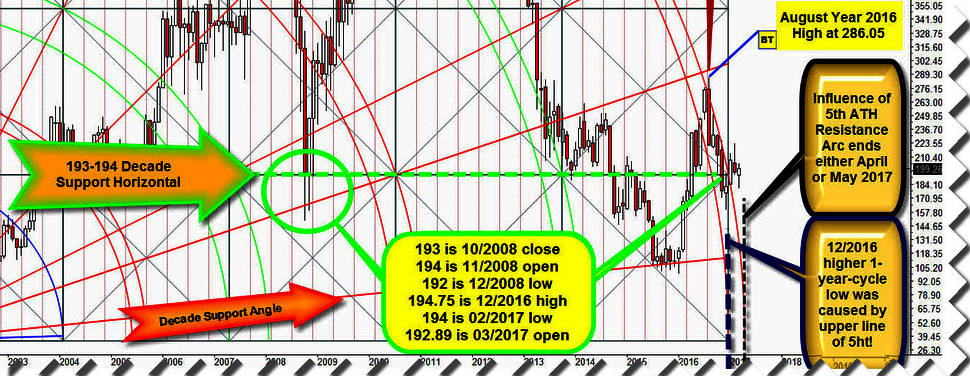
==> I think and I expect that the HUI is able to overcome its dominating 2017 resistance trail in course of November-December 2017. Reason for this expectant attitude is that this week low = current October low additionally tested back the 193-194pts area successfully from above, which is a horizontal HUI pivot in the major important DECADE TIME FRAME.
The last time I analyzed the importance of the 193-194 HUI-DECADE pivot was also the last time I´ve forcasted the HUI for the public - www.gunner24.com/newsletter/nl-032617 "HUI - Timing is always the Hardest Part":
See the most telling part of monthly HUI chart as delivered on 03/26/2017. Please observe by your own the light-green highlighted major importance of the 193-194 horizontal pivot. For the past, for this DECADE and for now...
==> If now this week low, the likely higher 3-month-cycle low, the likely next higher bull market low at same time found support at 193-194pts DECADE SUPPORT Horizontal and the rising yearly elliptical support a very powerfull weekly upcycle could emerge out of that combined yearly and DECADE support! A weekly upcycle which easily could unfold into December 2017, even January 2018, perhaps pulverizing any given resistance which was built this year.
Next, I would like to show you a piece of jewelery that illustrates that the HUI now is at the crossroads. Its the same weekly chart, as presented at the beginning of this Gold and Silver Miners buy recommendation. Same X axis/Y axis adjustments. Same price/time relation.
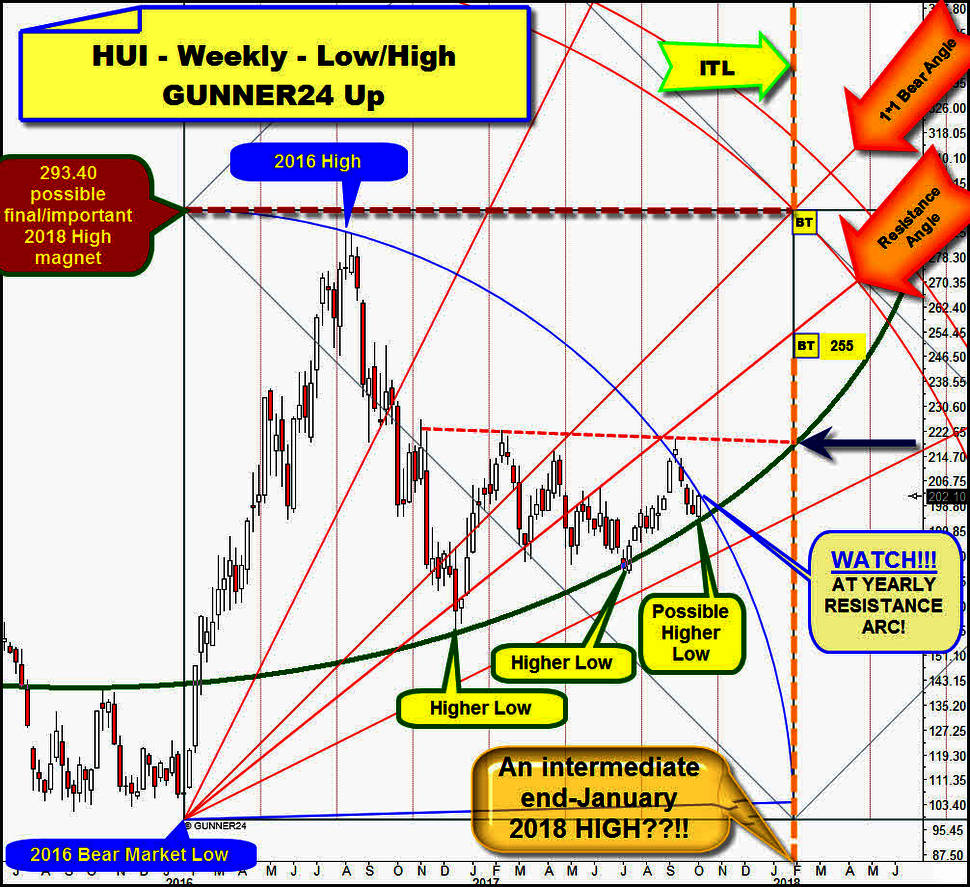
Over the weekly chart we create a very simple tool. A circular GUNNER24 Up Setup that measures from 2016 Bear Market Low upwards to the final high of 2016:
Thus the GUNNER24 Blue Arc represents circular resistance in the yearly time frame. This week top precisely tested the Blue Arc from below. Of course the Blue Arc is still a strong circular resistance although we observe 1 week close above the Blue Arc at last test of falling red-dotted 2017 resistance.
HUI is at crossroads; from below the elliptical support is pushing higher and from above the circular arc resistance is pushing lower. The HUI is squezeed, and ready for its sustainable decision.
As described and analyzed market should resolve higher, further on supported by dark-green-dotted rising elliptical support! Finally breaking its existing yearly Blue Arc resistance to the upside! And always when a confirmed important, strong holding yearly resistance breaks to the upside we have to expect a relative strong (according price and time) rally!
IF both, the dark-green-dotted rising elliptical support and 193-194 DECADE SUPPORT fail to give support, the Gold Miners are expected to sell-off hard into round about 150pts until December 2017! But this scenario has just a 20% odd because of the confirmed strength of the elliptical support and the 193-194 DECADE HORIZONTAL SUPPORT. Usually the miners will rally hard until year end once Blue Arc is next time overcome on weekly closing base.
Because the just important supports are so well defined you/we can use them as stop-loss for the recommended Gold and Silver Miners long entry. Think that any weekly HUI close below 190pts in course of October should be used as tear line for any new longs!
==> IF, and his is the most likely outcome, HUI fires a weekly close above the Blue Arc within next 3 trading weeks the falling red-dotted 2017 resistance becomes first target for the weekly upcycle. By the way, observe by your own how accurately the progress of the falling red-dotted 2017 resistance trail at the placed fat dark-blue arrow is in sync with the rising elliptical support and next important time line (ITL) for end-January 2018.
This sync-event and future important GUNNER24 Magnet points to an important time signal for end-January 2018 which usually signals important top or important low is due for then (always give +1/-1 candles for an upcoming ITL extreme).
==> According to the GUNNER24 Trading Rules the first decisive close above a Blue Arc within a GUNNER24 Up Setup fires finally these 2 uptargets which should be worked off with 75% odd each in uptrend direction:
A) The uptrend has to continue until the natural first square line resistance will be tested.
B) And/or the uptrend has to reach/test the lower line of 1st double arc.
Consequently the triple weekly GUNNER24 Up Magnet formed by 293.40-first square line resistance, lower line of 1st double arc and next ITL becomes natural main target for the uptrend out of this week next higher bull market low.
==> Accordingly, in the best bull case, the HUI could test the "round" 300 into end of Januray 2018/early-February 2018 before next multi-week/multi-month downtrend should begin.
Because such allowed hefty price rise in a short time requires a lot of confirmation, I would currently estimate the normal upwards target at 255pts/end-of January 2018, which is a backtest of former decisively downwards broken Resistance Angle (now rising angle resistance in the yearly time frame).
Be a part of our exclusive sworn GUNNER24 Trader Community – now... I try to make you rich!
- with daily trades – quick, safe and profitable…
- in well-chosen precious metals, commodities, indexes, currencies and in the best stocks worldwide...
- in both rising and falling markets…
- with little use of capital…
Be prepared!
Eduard Altmann


