Compared with the previous week all the important US stock markets could do better being supposed to have ended their weak phase of the end of September already. In the coming weeks the prices will also get the wind behind them by the Presidential Cycle which unambiguously documents that in the election years the stock markets use to tighten as the polls approach. Generally the markets start a six week rally at the beginning of October.
By that there are very good chances – as well from the chart-technical as from the cyclical points of view – that now the markets reach and overcome very fast the old yearly highs heading for the short- and medium-term GUNNER24 Up Targets:
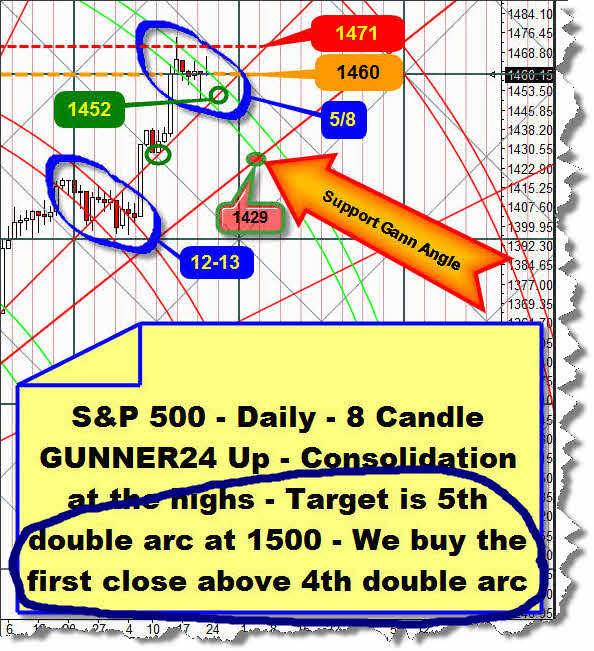
Last we had a look at the daily chart of the S&P 500 on September 23. See the detail from the last analysis above… At this moment we weren’t yet quite positive whether the index wanted to correct for five or for eight days. The market had to follow the 4th double arc downwards. Any significant day close above the 4th double arc would be the next buy signal because in that cased the main target of the setup above – 1500 – would be activated and have to be headed for, inevitably:
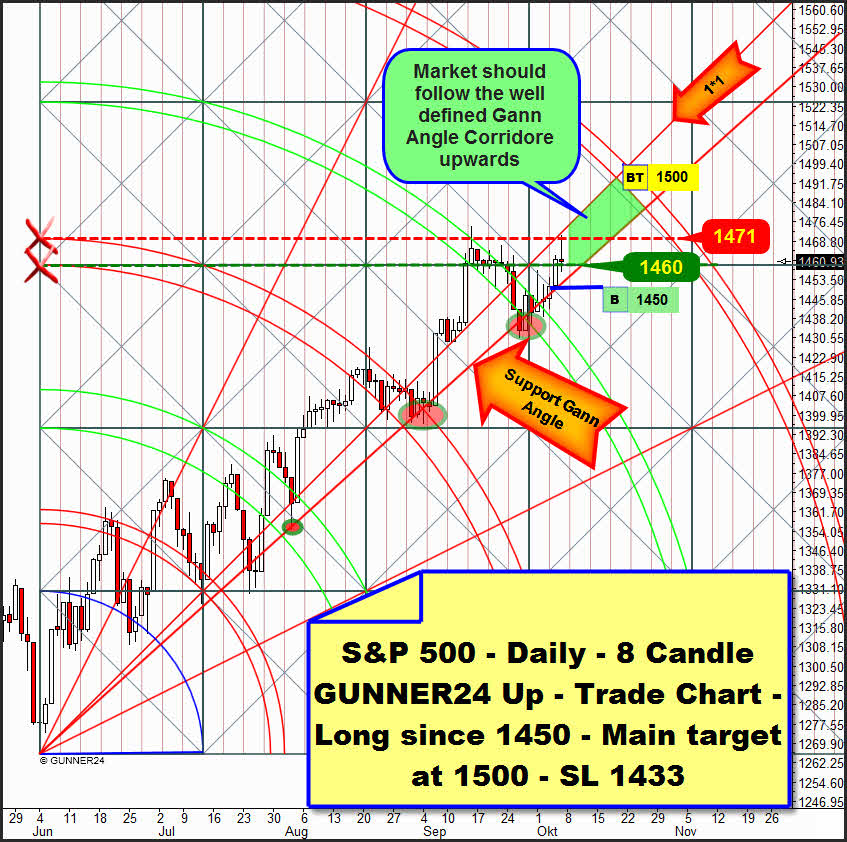
On the day after the yearly highs the market started an altogether eight day correction that followed the 4th double arc downwards well-ordered and civilized ending at the actual support Gann Angle. After the swing low of 09/26 at 1430.53 the 4th still held back the market before on Tuesday the first closing price above the 4th was generated. Then the Wednesday candle led to the first significant close above the 4th. Thereby the 1500 were definitely activated as the main target for this swing.
Now the 1500 are supposed to be reached within the next 13/14 days. The market is most likely now to run up – within the green grounded Gann Angle corridor above - to the 5th double arc towards the trend without severe up or down deflections.
A closing above the 1*1 resistance Gann Angle is not to be expected for next week. Not before the end of the actual up-move – around October 21/22 – a daily close above the 1*1 angle might happen. It would be a sign of an exhaustion of the up-move. Daily closings narrowly below the support Gann Angle – considering the lost motion – as occurred several times during the last weeks, are allowed. The SL for the actual long-position is a daily close below 1433.
Within the important US indexes the one that is actually showing most strenght is the Dow Jones. As the first out of the three US indexes constantly tracked by us it reached a new bull-market high. NASDAQ-100 and S&P 500 are going to join soon.
By virtue of the current Dow Jones strenght and a specific GUNNER24 Chart-Peculiarity we opened – against the rules – a weekly long-position in the Dow Jones as early as by the end of the last trading week:
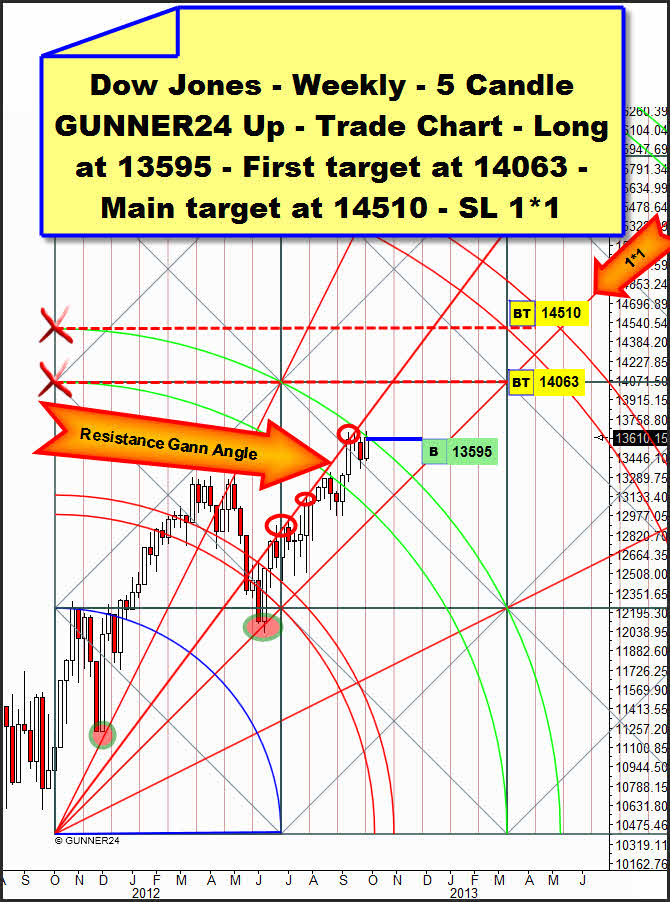
In the never published weekly 5 Candle GUNNER24 Up Setup above the four September candles worked their way up from the lower line of the 2nd until the proximity of the upper line of the 2nd. The last week closed pretty exactly at the resistance of the upper line of the 2nd. On Monday – I’m working on that assumption with a nearly 100% of probability – the market will open near the 13610 and thus above the resistance of the upper line of the second. So this resistance will be overcome by a jump thus being supposed to keep on accelerating the up-trend in the daily time frame that is already strong. I.E. the up-move is going to be visible in the weekly time frame, too, because the weekly candle will leave the little weekly consolidation pattern upwards. On the basis of this fact, as early as at the end of the last trading week we opened a weekly long-position without awaiting the confirmation for the weekly long, the final break of the 2nd double arc on weekly closing basis.
Subsequently, within three weeks the next important weekly resistance is expected to be reached. It’s the horizontal resistance that starts from the intersection point of the lower line of the 2nd with the beginning of the setup = 14063. That’s where the long position will be covered - MIT (market if touched).
Starting from the 14063 resistance a 2-4 week correction/sideways move is supposed to begin before in spring the market shall top at the 3rd double arc and the main target of 14510 index points.
The stop-loss for the long-position we went in recently, is a weekly close below the 1*1 support Gann Angle!
Be prepared!
Eduard Altmann


