In the American stock markets the last days were marked by some extensive tests of the existing GUNNER24 Supports. As well in the daily as in the weekly time frame. The new highs of this upswing beginning with the first September trading day were marked precisely at the end of September. Besides – that September 2010... Through 21 trading days the US markets went into one only direction: Upwards. Without any correction. Do you remember the following quotation from out the issue of 08/22/2010 of GUNNER24 Forecasts?
Well, the 90 % probability of rising prices otherwise prognosticated in that GUNNER24 Issue definitely arose, and we've brought in some tidy profits on the long side!
Now it looks as if next week will produce the next pre-decision whether the upwards trend in the US stock markets by the end of the year is going to be just as brutal similar as the existing gold and silver uptrends or if we will have to reckon on an extensive correction with the new month of October first before we can work our way up to the expected year high (end of November/beginning of December).
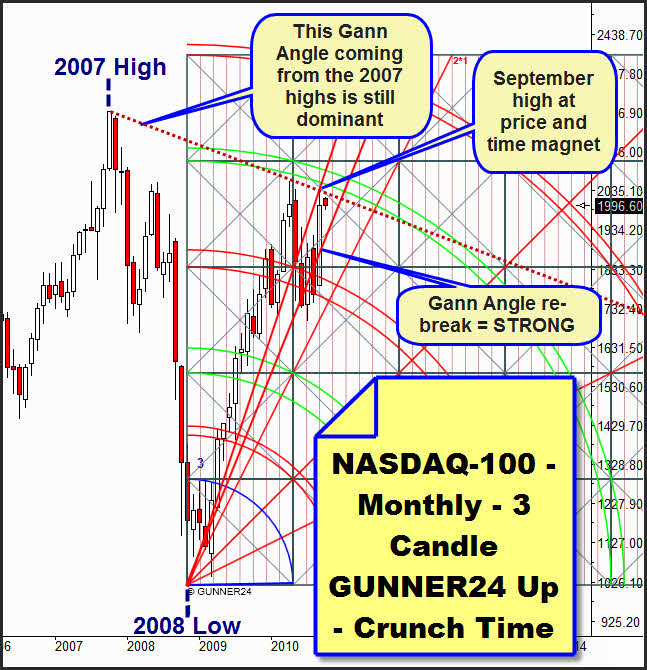
The facts: In the actual monthly 3 Candle GUNNER24 Up of the NASDAQ-100 the month of September reconquered the primary Gann Angle touching the Gann Angle above the price at 2129.65 with the September high. You might say last week even the revolution inhibitor was put in action, that Gann Angle, you see which is hampering the market in its intention to go on rising.
The situation becomes interesting by the fact that the September high is coinciding exactly at the intersection point of that Gann Angle and the Gann Angle which comes from the 2007 high, red dotted in the chart. Thus the high was formed at a price and time magnet permitting certain conclusions on the further price course. Zooming now into the chart some other important things catch our eyes:
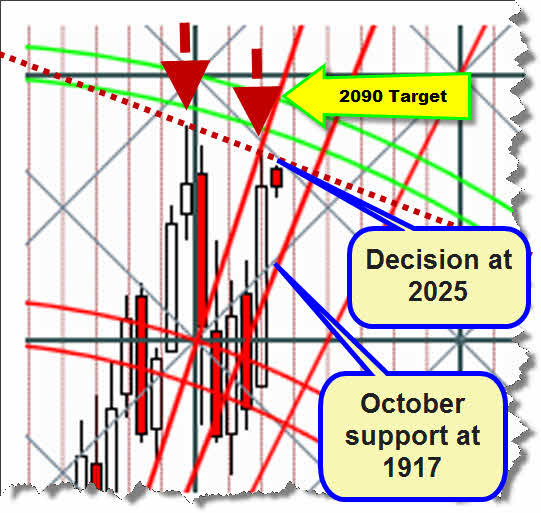
We discover that the Gann Angle from the 2007 high is pretty important for the market. That's exactly where the market had its actual year high in April, the rebound from that Gann Angle drove into a strong correction which was cought by the main target, the 3rd double arc. The rebound from the 3rd double arc confirmed the upwards trend of the market. The 4th double arc MUST!! be reached. The lower line of the 4th double arc is lying at 2058! But that hasn't happened yet. Last week the Gann Angle at least rang in a little consolidation. The October hasn't dared yet to approach that resistance angle. Thus it may perform like May. The May did not want to approach or touch it, respectively.
So there are two different forces which effect the October candle. On the one hand they want to pull up the lately dominating upwards forces. Those are: The magnet 4th double arc and the rebound energy from the 3rd double arc with the connected re-break of the primary Gann Angle.
On the other hand, the falling 2007 Gann Angle is proved to be a strong opponent to the market of which – with the September high – it was given such a strong hook by which perhaps at first it has to fall back onto 1917 approximately in order to reach the 4th double arc in the next attempt then.
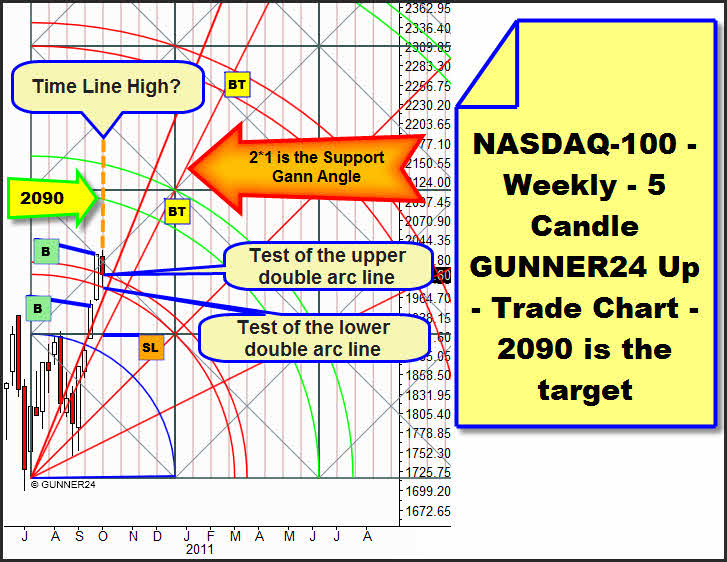
The decision will be due next week. A week closing price of more than 2030 would mean that until the end of the year we will see at least the 2090 or even the 2150. That's my main tendency because the actual weekly GUNNER24 Up Setup makes me suppose so:
From my point of view the market tested the first double arc significantly last week. It seems to turn out a support. The weekly close is above the upper line, the weekly low was marked exactly on the lower line of the first double arc. We're in the 13th(!) week of the upswing however AND the 13th week marked the high exactly on the important time line in the middle of the square. Unambiguous signs for a top. Can you see the influence of the important 2007 Gann Angle in the weekly setup as well?!
But at least we've got a buy setup in front of us here. And until now everything is going according to the textbook:
A clean 5 candle initial impulse, a clean test of the 1*2 Gann Angle with a strong candle which in one go hit as well the blue arc as the upper limiting line of the first square, then a clean break of the first double arc with a following test of that first arc. Why should the price deviate now from its plan to reach at least the 2nd double arc?!
I certainly suppose that next week a tough fight for the 2025 will begin. Crunch Time. The upwards forces should dominate. A daily close above 2030 should make us test the year high at 2060 in one go. It's becoming obvious that there'll be a rebound there. I even suppose that an extensive correction will begin there which will test back the ominous 2007 Gann Angle. But in case of a daily close of less than 1975 we'll have to reckon on a test of the October support at 1917.
|
The Complete GUNNER24 Trading and Forecasting Course will give you the critical knowledge you need to forecast and analyze the markets with the GUNNER24 Forecasting Technique. The NEW course is a must for any trader/investor who wants to understand this innovative and revolutionary forecasting method and use it successfully in everyday trading. The materials in this course are all you will ever need if you plan to trade the markets and make a living doing so.
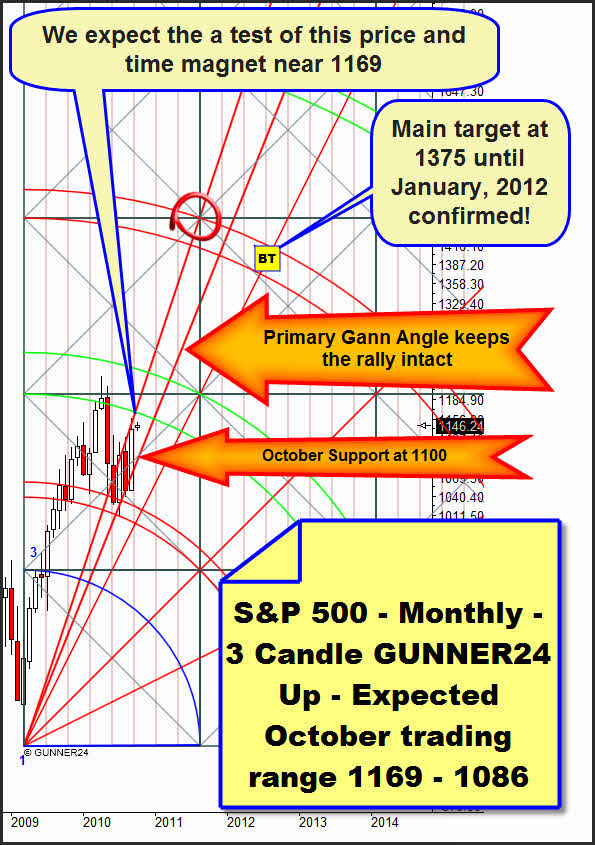
The situation: With the September candle as well the NASDAQ-100 as the primary Gann Angle were reconquered and the rise of the Gann Angle above the price was stopped. The price and time magnet above the price is lying at 1269 and it's obvious that we'll go for it next week. The trend is your friend. Those 1269 are corresponding to a NASDAQ-100 of 2060. Sic!
In the daily 8 Candle GUNNER24 Up Setup we went long with the final break of the 2nd double arc. Target are the 1169 where we will cover anyway. From my point of view it's interesting that within the current consolidation the primary Gann Angle has not been tested for the second time. The reason seems to be the surprisingly strong horizontal support at 1141 which we can anchor in the setup. I just suppose that the said test will be due Monday or Tuesday being able then to produce the rebound energy that is necessary to go for the 1*1 Gann Angle. Furthermore conspicuous is the fact that the main target, the 3rd double arc will still be 12 trading days away if the price continues in its defined corridor...that should wear down the bears very much. SL for our long is the primary Gann Angle. You will be able to dare a short term sell after the 1169 will have been gone for. AND if then the primary Gann Angle will have been broken on day closing price basis.
To the Gold:
Well, what is to be said about it apart from the fact that there are no sellers any more and obviously there are only dip buyers left.
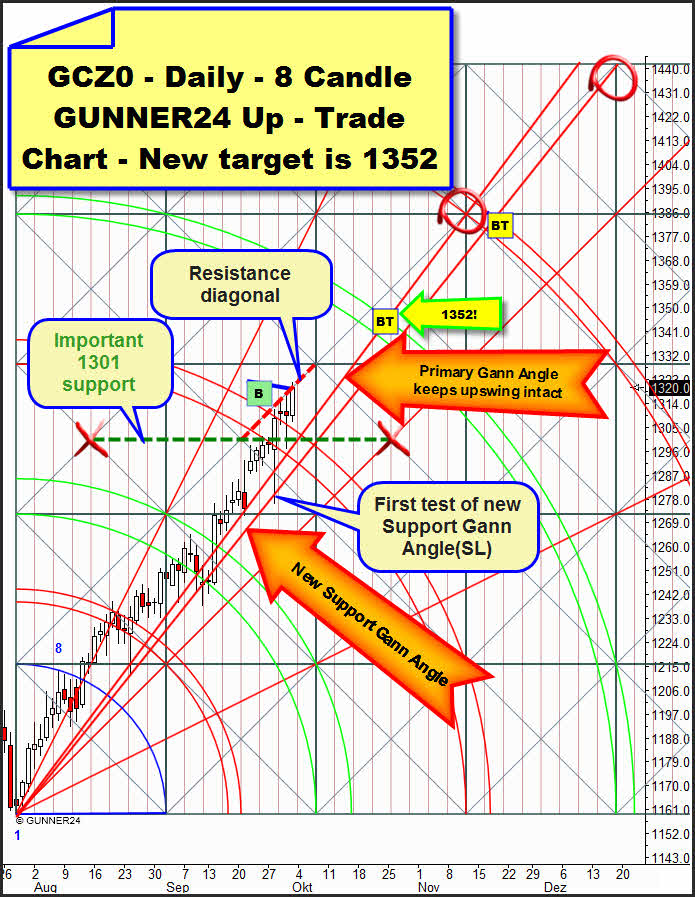
With Friday the 3rd double arc was broken, we went long again at 1320 with target 1352. This daily target is corresponding with the target we worked out in the last issue in the Monthly 8 Candle GUNNER24 Up, the upper line of the 2nd double arc.
Furthermore there is nothing that points to an end of the trend. Friday was the 47th day of the uptrend so we can expect eight more days of rising prices. Last week was the 9th week of rising prices. Actually that means that now we won't have to reckon on a change in trend before the 13th week approximately. That also means that even in case of a very sharp correction on daily basis we will be able to go long again, the corresponding reversal signals provided – and even that the final high of this up swing is still pending. Further that means that Monday or Tuesday we'll mark another top at a 99 % of probability.
Corrections should end next week at the setup-anchored green broken support horizontal at 1301 or at the primary and/or at the newly defined support Gann Angle. A break through of the red marked resistance diagonal would turn the rise parabolic. Price and time magnet then would be the 2*1 Gann Angle.
Be prepared!
Eduard Altmann


