Below a new forecast on Newmont Corp., that I originally created for my Trade of the Day traders on Thursday. The charts below are based on the Wednesday`s closing price. With regard to this, nearly nothing has changed compared to the closing auction of the week, which only reinforces the following outlook.
View looks very solid to me and above all gives us a first valuable indication WHEN the Precious Metals universe should end this quite severe downtrend cycle and then start a hard and longlasting bounce.
Usually when Newmont has reached its below analyzed attractive mega-support this should happen afterwards. I expect the Newmont mega-support = ideal backtest target to be hit sometime during the next week. Enjoy!
========================================
Dear GUNNER24 Traders,
The 1:3 Trade: Buy Newmont Corp. at 56.90
Our 1:3 trades are A) adjusted to a longer term, having a spacious stop-loss for the development not to be endangered and B) have to show a risk-reward ratio of more than 1:3.
We want the Leader of the Pack
Newmont Corporation (NEM) is NYSE listed highly profitable Big Cap Gold Miner that engages in the production and exploration of gold, copper, silver, zinc, and lead. The company has operations and/or assets in the United States, Canada, Mexico, Dominican Republic, Peru, Suriname, Argentina, Chile, Australia, and Ghana. As of December 31, 2019, it had proven and probable gold reserves of 100.2 million ounces and land position of 68,300 square kilometers. The company has a strategic alliance agreement with Kirkland Lake Gold Ltd. to assess regional exploration opportunities around the company's Timmins properties and Kirkland's Holt Complex in Ontario, Canada. Newmont Corporation was founded in 1916 and is headquartered in Greenwood Village, Colorado.
The gold and most of the Gold & Silver Miners are declining sharply lower, are in panic sell-off mode that always tend to run for 7 to 12 trading sessions. It looks that today will be the 5th, maybe 6th day of panic cycle on Mining Stocks. It is true that gold, silver and miners are falling in line with the major stock indexes.
Very often, they trade right with the major stock indexes contrary to popular belief that they are always the safety trade when stocks fall.
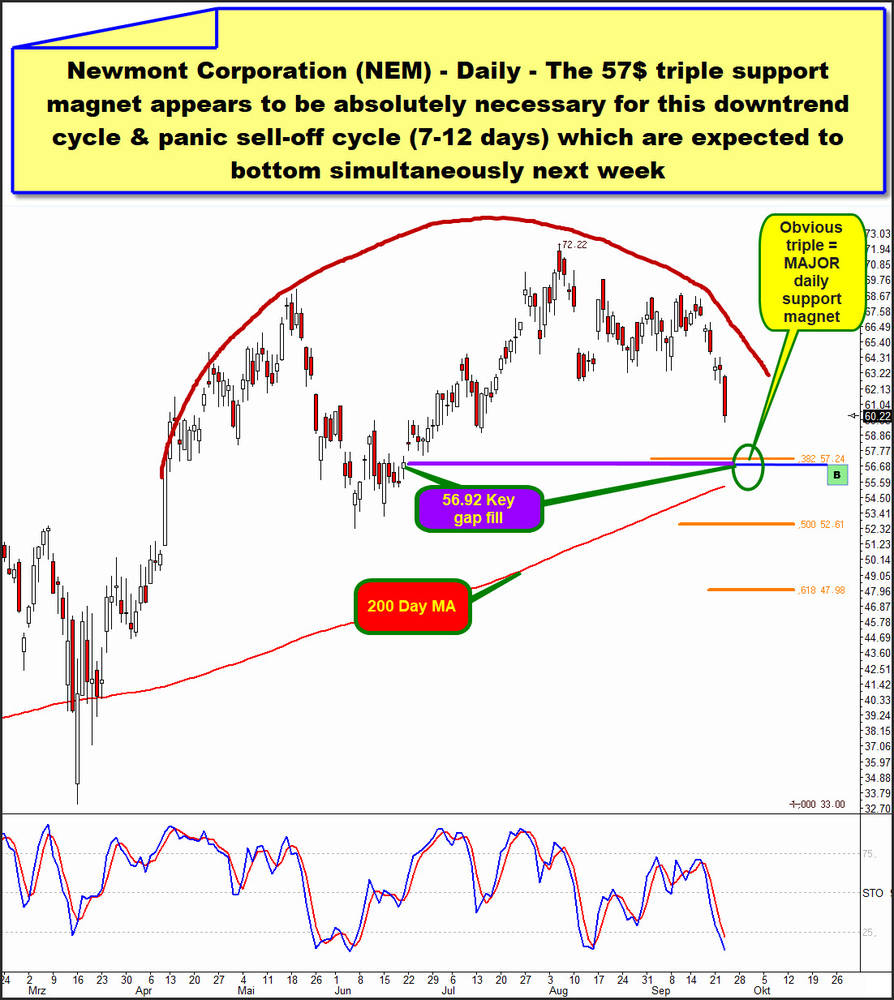
Also the always leading Gold Miner in the market is coming under pressure. This gold mining giant peaked on August 5th, 2020 at 72.22$ a share.
Wednesday Newmont Mining stock was dropped to 60.22$, showing a -3.23$/-5.09% loss for the day.
After a rounded topping formation confirmed, the stock is now trading below its 50 and 100-Day moving averages. This puts the stock in a weak technical position on the charts in the near term and points to a sell-off continuation into ...:
The next key support level for NEM shares is the MAJOR one at the 57.00$. This level is a key retrace area which should first serve as triple support magnet on daily base. There unite towards the expected end of this panic sell-off cycle:
1. The 56.92$ Key Gap fill support area from June 19th, 2020.
2. The 200 Day moving average, always big, big natural support and backtest magnet.
3. And last but not least, the 38.2% Fib support retracement level from 2020 Low to 2020 ATH rally leg what runs for ever at the 57.24$.
We try to 1:3-buy NEM shares at this tight daily triple support magnet zone what at same time ADDITIONALLY represents nearest triple support magnet in the weekly chart.
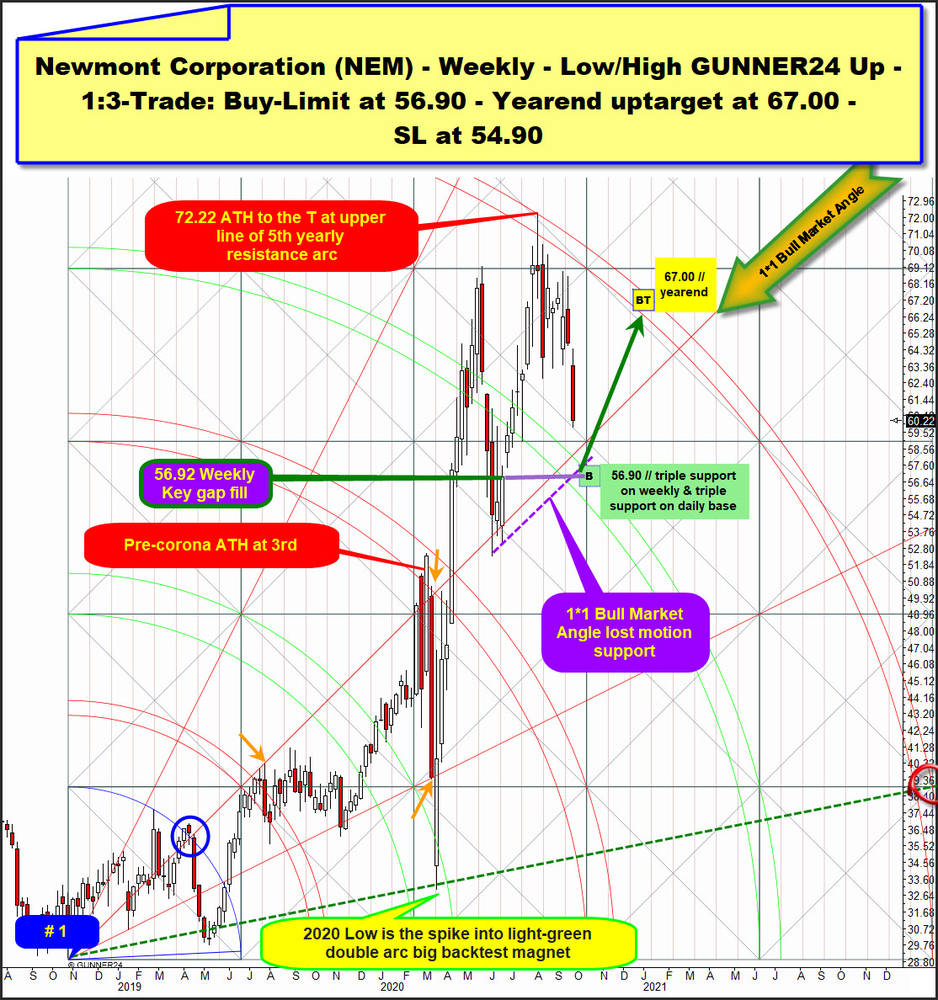
For this we switch to the weekly chart. This below is biggest possible valid picture of NEM on weekly base. It starts measuring to the upside at # 1 // final bear market low that was printed October 2018 at 29.06$. The up setup is a Low/High one as it measures from # 1 // final bear market low upward to the very first major top of 2019::
So we can recognize that the pre-corona alltime-high was nailed very perfectly at the natural GUNNER24 3rd Double arc uptarget/resistance. The 3rd double arc is a red one.
The corona sell-off cycle has ended at the VERY classic backtest of the former upward broken 2nd double arc. At that time main/yearly main support cushion and ideal backtest target. There and at the within setup naturally anchorable Gann Angle the final low of 2020 is printed. The 2nd double arc is a light-green rail.
And up she went, switching into 2020 rally cycle what 1000% accurately and finally topped at upper line of 5th double arc. PERFECT! 72.22$ alltime-high (ATH) came in at upper line of 5th and this started the correction which now obviously is on its way to test back the prior finally upward broken, now future 4th double arc support environment. Please remember that the 5th double arcs are ALWAYS main targets for the trend. Consequently this 5th should offer MAJOR RESISTANCE at next test because the 5th is now a confirmed yearly double arc resistance!
==> Again, a wave/cycle – likely only a corrective wave/cycle –, that was triggered by a red double arc resistance seems to have to test back and reach the light-green double arc underneath.
Well, and usually the price hit of the 4th double arc, this classic natural backtest zone, will take place within a few days. Most likely sometime next week what is the time window defined earlier at another place for the next important intermediate low on US stocks.
AT SAME TIME the most important secular bull market support, what always is the 1*1 Gann Angle, would also have to be tested back!
The all in all just second backtest of the 1*1 Bull Market Gann Angle is pending = likely absolute necessary soon.
And by surprise, the Key Gap fill – what is a bullish weekly breakaway gap – for the next trading week unites with 4th double arc ideal backtest target & 1*1 Bull Market Angle always MOOOST ideal backtest target, at that 56.92$ magnet.
==> Thus, we have now identified a triple support on the daily chart at 57$ for the next week and a triple support on weekly base running at 57$. Also close to 57$ runs the MAJOR important backtest support rail of 1*1 Bull Market Angle.
==> this is an extremely rare GUNNER24 Magnet Combination and suggests that the 57 $ should offer a future CONCRETE support, means usually an unbreakable support. At least for this likely soon due hit.
Therefore: Where else should we buy NEM for a classic some months long backtest cycle that usually has to test back the yearly 5th double arc resistance at 67$ surroundings towards end of 2020?!!!!:
==> 1:3-Trade Buy-Limit order at 56.90$! The Buy-Limit order is valid until next week Friday, October 2nd!
==> Yearend uptarget is the classic backtest of the yearly 5th double arc main resistance upmagnet at 67.00$ surroundings!
Please place the SL for that possibly triggered 1:3-NEM long engagement at the 54.90$!
Risk = 2.00$. Potential reward = 11.10$. Risk-reward ratio 2.00/11.10 or 1:5.55
GUNNER24 Trade of the Day orders for 09/24/2020:
Market: Newmont Corporation (NEM)
Orders: Buy-Limit at 56.90. Stop-Loss (SL) at 54.90. Yearend uptarget at 67.00. Buy-Limit order valid until 10/02/2020.
Eduard
========================
Be a part of our exclusive sworn GUNNER24 Trader Community – now... I try to make you rich!
- with daily trades – quick, safe and profitable…
- in well-chosen precious metals, commodities, indexes, currencies and in the best stocks worldwide...
- in both rising and falling markets…
- with little use of capital…
Be prepared!
Eduard Altmann


