After the significant Friday decline, I had to spend several hours for rifling through many dozens of GUNNER24 Setups to determine the/one "reason" for the really good and proper Friday sell-off.
There was neither a weekly nor a monthly setup on the Dow Jones, S&P 500, Russell 2000, NASDAQ Composite, DAX, FTSE 100 etc. that might have made available any clue resp. important resistance magnet/Gann Angle to explain why the stock markets were shaken out of their several week deep-sleep mode on Friday of all days.
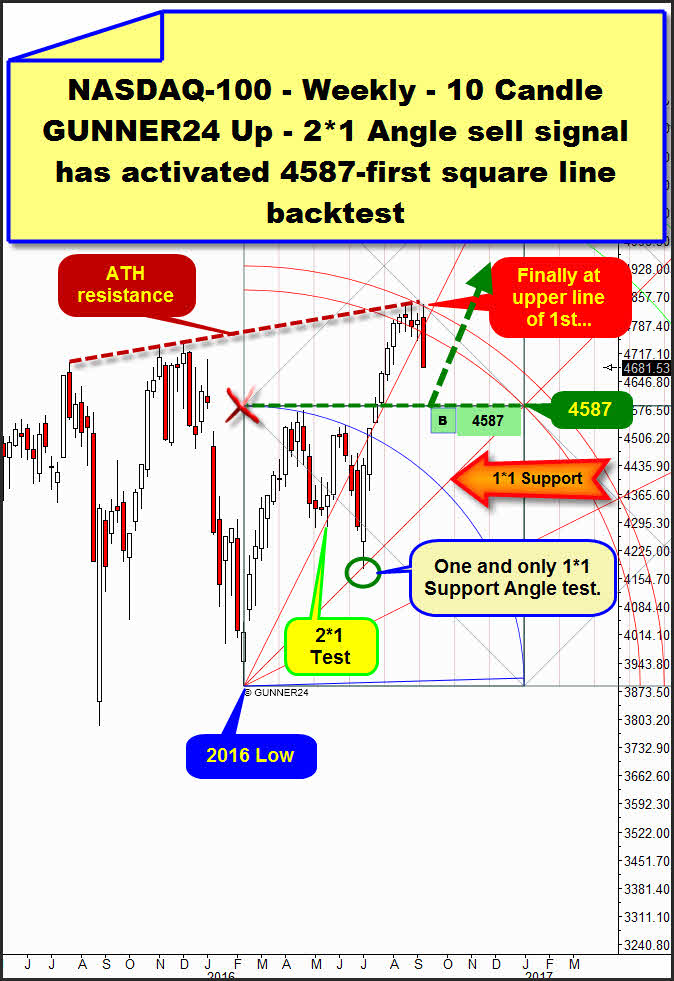
Thereby – as to my present comprehension – only the upper line of the 1st double arc in the following setup in the weekly time frame on the NASDAQ-100 can have been the reason for the sell-off:
It’s matter of a 10 Candle up that can be applied at the year low. After finishing the first 10 week initial up impulse, the NASDAQ-100 corrected during 11 weeks. The correction came to its end in terms of price at the first 1*1 Support Angle test = 50% first initial up impulse backtest. By reaching the 1*1 Support Angle at the post-Brexit-referendum low, the second sustainable upmove of the 2016 uptrend year started that succeeded in breaking upwards the Blue Arc as well as the 4587 first square line in the further course.
Therewith, the lower line of the 1st double arc was activated as the next important uptarget in the weekly time frame.
During the last couple of weeks, the index spent its time in eking out some new small higher alltime-highs in the 1st double arc environment. Altogether four weekly closings within the lines of the 1st double arc could be crested ==> This positive comportment clearly points to the 1st double arc resistance to be overcome ultimately in the pretty near future the current uptrend being supposed to last many weeks/even months.
With the Wednesday high, the last week candle touched the upper line of the 1st for the very first time. This first test of the upper line of the 1st in the NASDAQ-100 was certainly the trigger and reason for the Western stock markets to begin weakening afterwards, selling off towards the weekend. I don’t think that the existing ATH (alltime-high) resistance newly came into play at the week high. That’s why it was rather the upper line of the 1st double arc that drove the stock markets to their knees.
==> The setup above signals – since no other elementary support seems to be important enough nor is present – that the NASDAQ-100 index needs a backtest of the important and strong 4587 first square line before the uptrend will newly be resumed… in whose further course through the year-end 2016 some new highs should have to be achieved.
==> I strongly doubt in the 4587 to be reached in the current downtrend however! I mean, at the moment we are experiencing this:
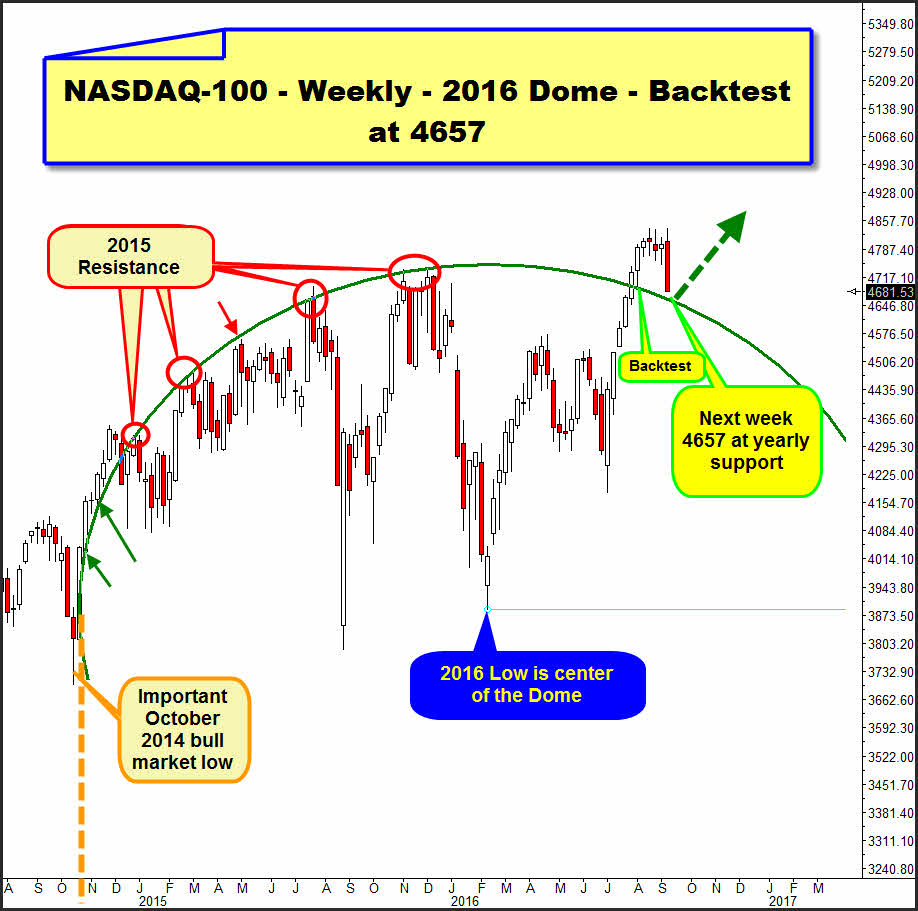
In the weekly chart above, I placed an elliptic structure that is the Alpha and Omega, in my opinion – from October 2014 till year-end 2014, for the entire 2015, now as well for the trading year 2016 and probably far into the year 2017.
Basically, it speaks for itself. Center of the elliptic structure = "2016 Dome" is the attained year low 2016.
From the important higher October 2014 bull-market high, the 2016 Dome starts exerting its influence to the market. This event is illustrated by the orange dotted vertical fall line that gauges/calipers the most extreme past extension of the 2016 Dome.
From the October 2014 low into the month of December 2014, the weekly candles of the NASDAQ-100 act predominantly above the Dome structure. Thereby, the Dome delivered extremely important support on yearly base in 2014 = 2014 year support.
The Dome was the most important market resistance from January 2015 into December 2015 – a resistance negatively tested many, many times. The very last negative test of the Dome ensued in December 2015 being the trigger for the extremely weak start into the trading year 2016.
We can state thus, that the Dome delivered nothing but resistance in 2015. ==> For 2015, the Dome was a yearly resistance.
After the NASDAQ-100 rose from the dead at the 2016 low starting the current rally, in the course of July 2016, the Dome could be overcome finally. Thereby, in July 2016 also a structure was overcome that exerts dominance in the yearly time frame. It was nothing but this final overcoming the Dome that in succession permitted new alltime-highs = new decade highs = new millennium highs!!! in the index.
==> The purposeful use of the term "millennium" alone has to make abundantly clear to you, dear reader and trader, the importance and (future) relevance of the 2016 Dome on this market.
This NASDAQ-100-2016 Dome is THAT important for this leader… and thereby also for all the other Western broader stock markets.
==> Well, I think the NASDAQ-100 is going to test back the 2016 Dome support now. It will carry out a very first SERIOUS 2016 Dome backtest. "Technically", the 2016 Dome will uphold finally on weekly closing base! It is simply a too important support at the moment = most important support for the rest of the year 2016 and beyond!!
I think, the index will test the year 2016 4657-Dome support to resume afterwards its bull-market trend again!
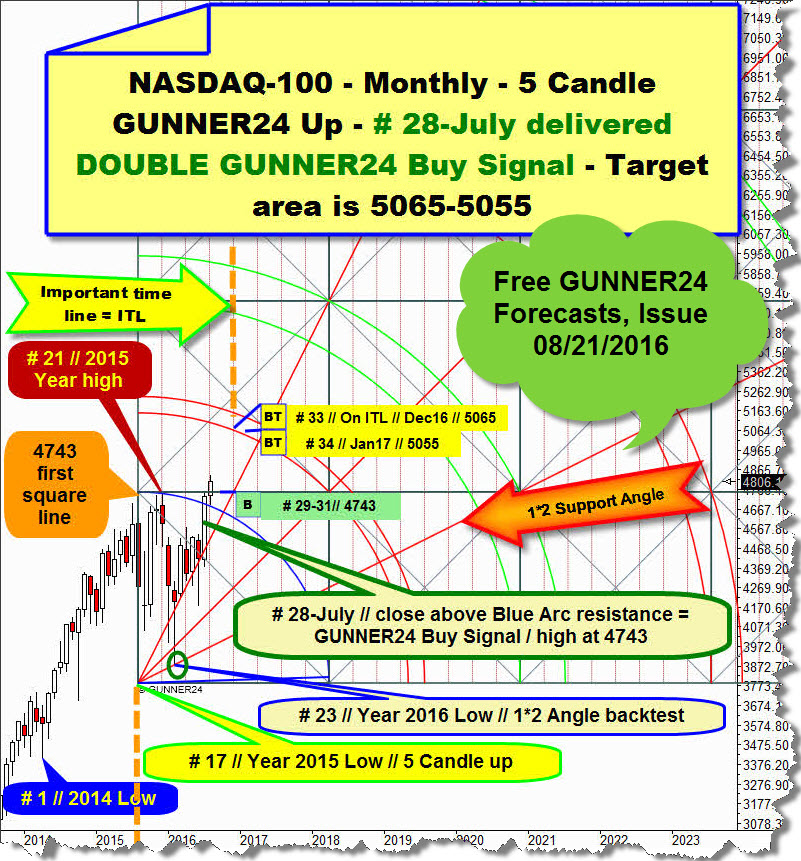
Above, you see the currently most dominating GUNNER24 Up Setup for the index. It’s a monthly up applied at the important final low of the year 2015 (= month # 17 of the whole upmove that began at the 2014 low).
Watch out: On 08/21/2016, I recommended a long-term long-entry at the rather safely calculable backtest of the 4743 first square line. This backtest should have had to take place in the course of the rest of August = # 29 resp. in the course of September = # 30 and/or October = # 31.
==> After a successful test of the 4743 horizontal = on monthly closing base!, the lower line of the 1st double arc upmagnet can be expected to be worked off till year-end 2016…
On Friday the index cracked vehemently through the 4743-horizontal support closing at 4681.53. What is that supposed to mean from the GUNNER24 point of view? In the short and medium terms?
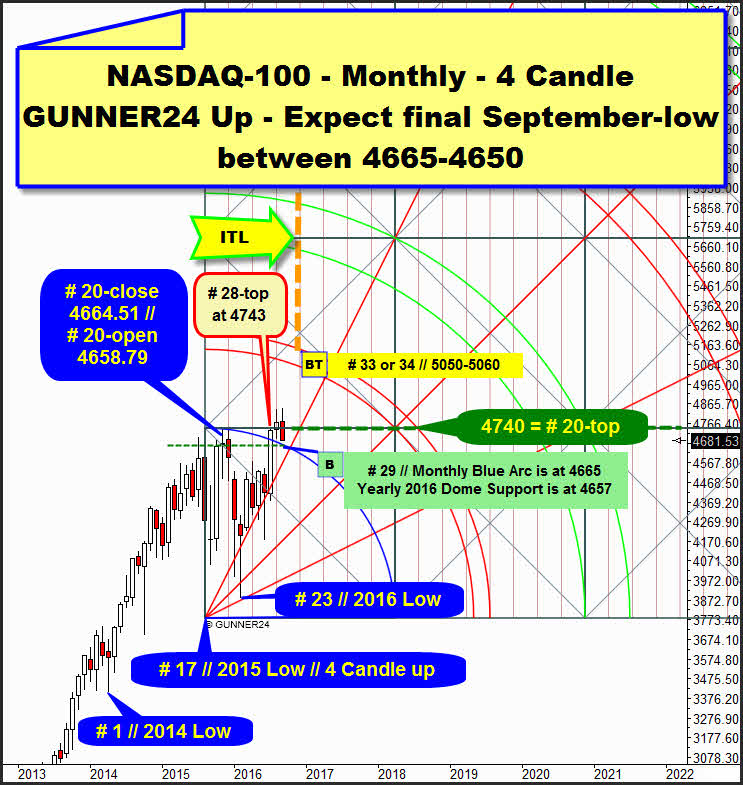
We know that the index will certainly have to reach its 2016 Dome support at 4657 next week. Gauging now tust a 4 candles up impulse in the monthly time frame, I get the following picture:
Starting from the extremely important # 17-2015 low, the initial up impulse gauge thereby ends at the # 20-high instead of the # 21-top as before. This overlay is likewise legit = valid because the monthly high of # 20 is virtually in a tie to the # 21-Fib number high furthermore being reached the high of the # 28 candle pinpoint at the first square line (4740) now adjusted downwards a little.
Since now the current September candle (# 30) quotes pretty plainly below the 4740 first square line = important monthly closing base support, now comes into play of course the Blue Arc mega support as next attainable and important support.
==> The Blue Arc takes its course at 4665-4660 pts for September. Thereby, this important backtest magnet in the monthly time frame is nearly identic with the 2016 Dome support that is at 4657 for next week after all (for the week after next it resides at about 4650…).
==> GUNNER24 indicates that this decline will be short-lived, because the newly heading NASDAQ-100 – recently performing some new alltime-highs in 2016 – is most likely to be about to just test back important and actually mega hard support. I think, technically the NASDAQ-100 should have to reach and in the worst case minimally dent the combined monthly + yearly support between 4665-4660 (Blue Arc above) and 2016 Dome at 4657 till coming Wednesday. Maybe down to 4650! After the supports being tested back successfully, the bull market shall have to be resumed!
Important announcement: I am taking some days off to recharge myself. Thereby, the next Sunday issue of the free GUNNER24 Forecasts is omitted. Correspondingly, the next free GUNNER24 Forecasts will be issued on September 25, 2016!
Be prepared!
Eduard Altmann


