Affliction all round coming for metals. Both, DBB base metals ETF and US Copper looking to have topped out at the beginning of the week, followed by a nasty Friday-sell off which broke nearest supports without any hesitation. US Copper has little chance of going higher next few months and into year-end although I would make a concession for marginal further short-term gain as it forms a top.
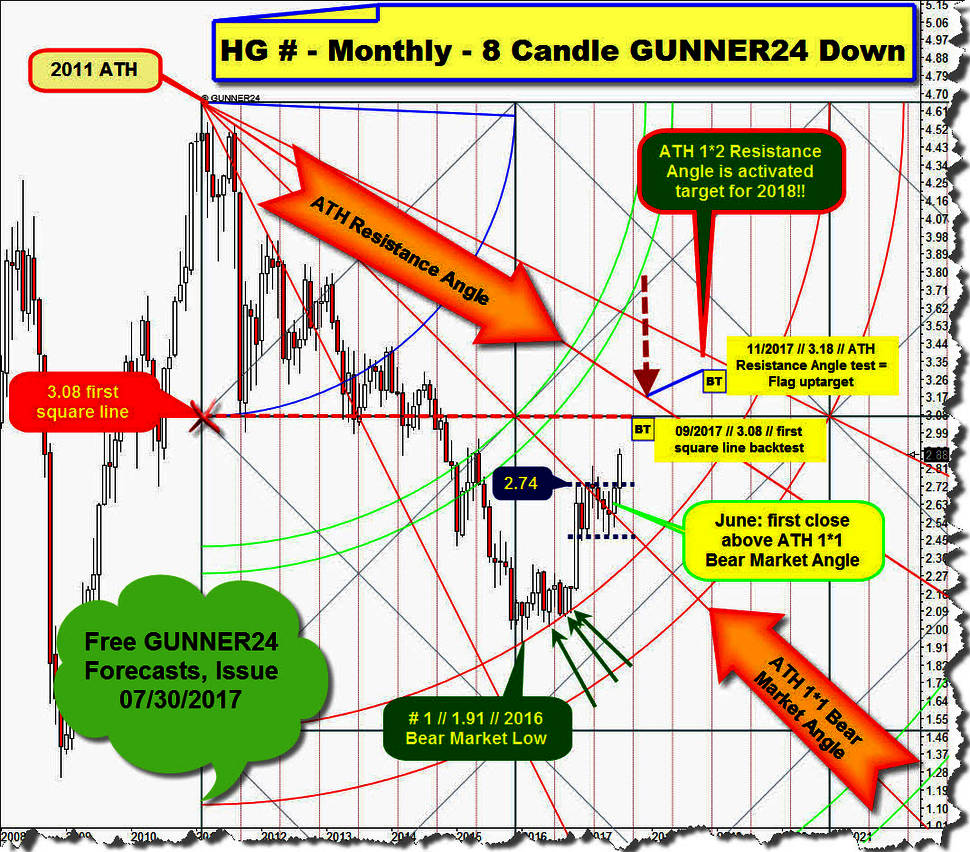
On 07/30/2017 (click here to re-read my latests copper forecast ...) US Copper was set up for a 3.08$ uptarget which at latest should be worked off in course of the current September or the backtest of the ATH Resistance Angle at 3.18$ till November 2017 after the June 2017 closed far above the ATH 1*1 Bear Market Angle and the July 2017 close broke the 2.74$ "high and tight flag"-resistance which kept the market back for 8 long months.
==> "High and tight flags are the best performing chart pattern in both bull and bear markets" - Thomas Bulkowski. Source: thepatternsite.com/htf.html
==> The activated "high and tight flag"-uptarget was identified at 3.18$.
Red metal 3.08$ uptarget is the first square line magnet within the still most dominating 8 Candle down setup that is being applied at the 2011 alltime-high (ATH). I´ve expected the monthly ATH Resistance Angle uptarget to be worked off likely in 11/2017, because then the 3.18$ "high and tight flag"-uptarget together with the ATH Resistance Angle forms most attracting future GUNNER24 Price/Time magnet.
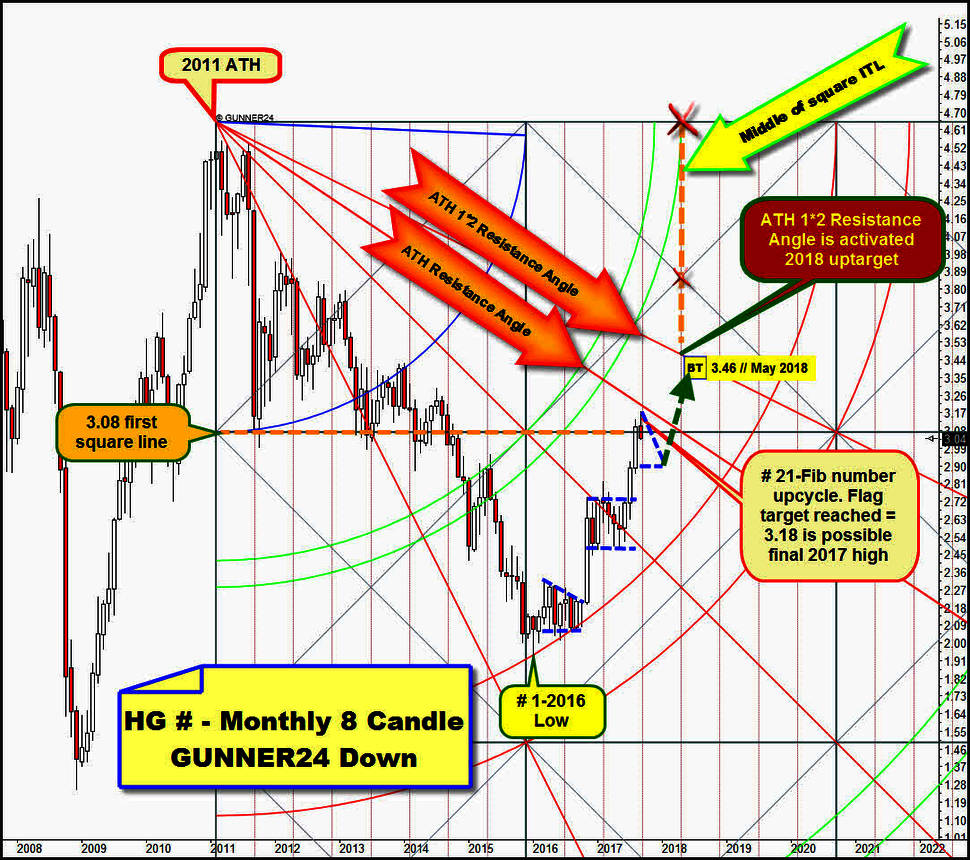
Finally on Labor Day the most traded US Copper December 2017 future contract topped out at 3.18$, afterwards closing the week at 3.0405$:
Above, you see the actual copper chart in the monthly time frame through the 8 Candle down lens.
The Labor Day top worked off the "high and tight flag"-copper uptarget and because that top triggered a sell-off and a new daily down cycle and is set at the 21st candle of this bull market, the 3.18$ is very, very likely an important intermediate top and with a +60% odd the final high of 2017.
==> 1 more tiny higher high at 3.19$-3.20$ into October is possible and allowed regarding GUNNER24, because the ATH Resistance Angle remains future uptarget for the copper bull and HAS TO BE WORKED OFF within overall uptrend. If this will occure in course of October the ATH Resistance Angle is at the discussed 3.19$-3.20$.
==> Another topping process in the weekly and monthly time frame has started at Labor Day high and the coming months (till end of 2017/early 2018) copper should work on its next multi-month lasting bullish consolidation pattern. A Wedge, a Flag, a Channel, a Pennant, what ever... that finally should resolve to the upside after its completion, working off the ATH 1*2 Resistance Angle at 3.46$ perhaps in course of May 2018. The ATH 1*2 Resistance Angle became automatically most attracting GUNNER24 Main Uptarget for the copper bull market afterwards the ATH 1*1 Bear Market Angle was finally overcome at made June 2017 high close!
The next important intermediate time line (ITL/orange dotted) in reach is the middle of the just passed square which lies at the May 2018 candle. ITL together with the ATH 1*2 Resistance Angle form most attracting future bull market upmagnet resistance at 3.46$ surroundings!
==> Next GUNNER24 Main Uptarget for the copper bull is the test of the ATH 1*2 Resistance Angle which is at 3.46$ for May 2018!
Below follows the proof why the market could have topped finally, why a topping process should be underway, why 3.18$ with a high odd is the final 2017 high and why the next bullish multi-month consolidation cycle should have begun:
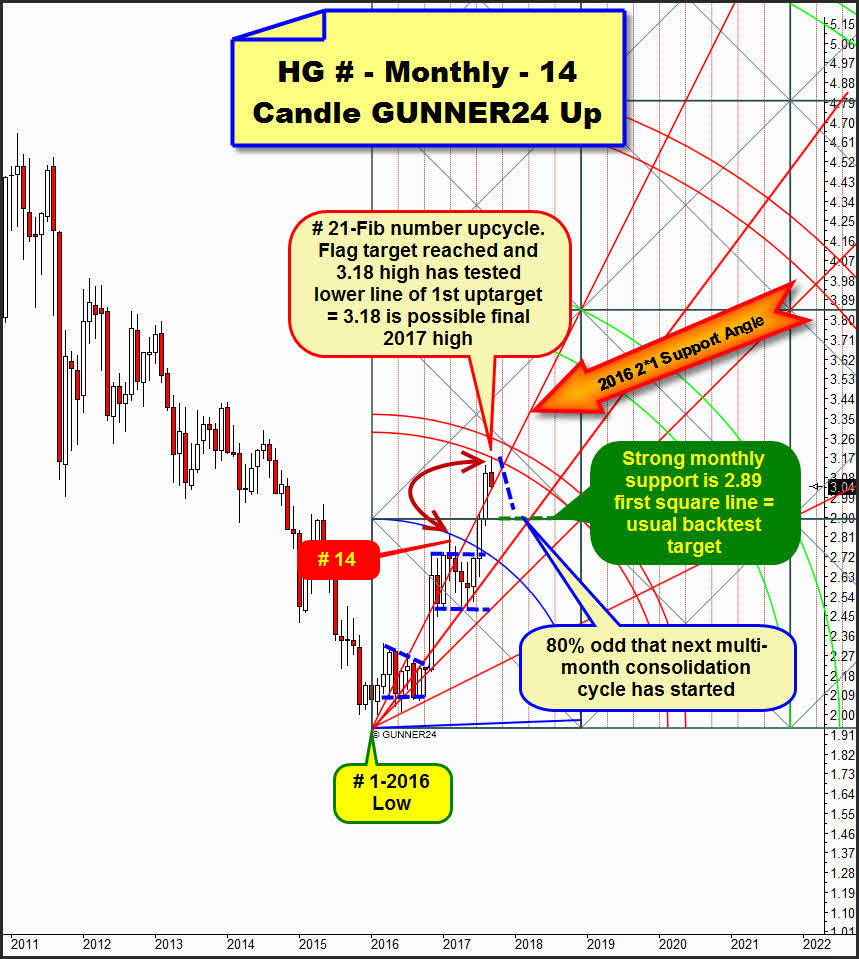
At present the 14 Candle GUNNER24 Up Setup positioned in the monthly chart above nails down the most important bull market resistances and supports best…
Setup starts at the reached # 1-2016 bear market low measuring up to the top of the 14th candle which was the early 2017 top. This placement of the Blue Arc nails the Labor Day 3.18$-2017 year high pinpoint to the natural uptarget of the lower line of 1st double arc resistance which became activated bull market uptarget after copper succeeded in overcoming the "high and tight flag"-resistance and the Blue Arc resistance at July 2017 high close, which in turn exactly was at the natural first square line horizontal.
That copper began its decline on Labor Day after working off its "high and tight flag"-uptarget in accordance with its activated upper line of 1st GUNNER24 Uptarget is an unequivocally signal that price has met time and that usually means that the trend has changed. Further on suspicious is that the 3.18$-"price has met time-call" occurs in course of the 21st bull market month, which per se often points to a trend change cause the 21 is a time signal.
Fridays sell-off = week close stopped precisely at 2016 2*1 Support Angle. This is our next confirmation that the 2016 2*1 Support Angle is important for this copper bull. Most recently, this support was respected accurately at July 2017 high and accordingly, we can derive an important signal from the confirmed importance of this angle.
==> A first weekly close below 3.02$ in further course of September FINALLY activates the backtest of the 2.89$-first square line support for the newly started trend = consolidation within strong bull market.
The observation that the 2016 2*1 Support Angle still is intact allows... as mentioned above ... marginal further short-term gains! Copper probably will test back the lower line of 1st in course of September and October and even is allowed to print another small higher year high at 3.20$ or so, but this path has just a 20% odd!
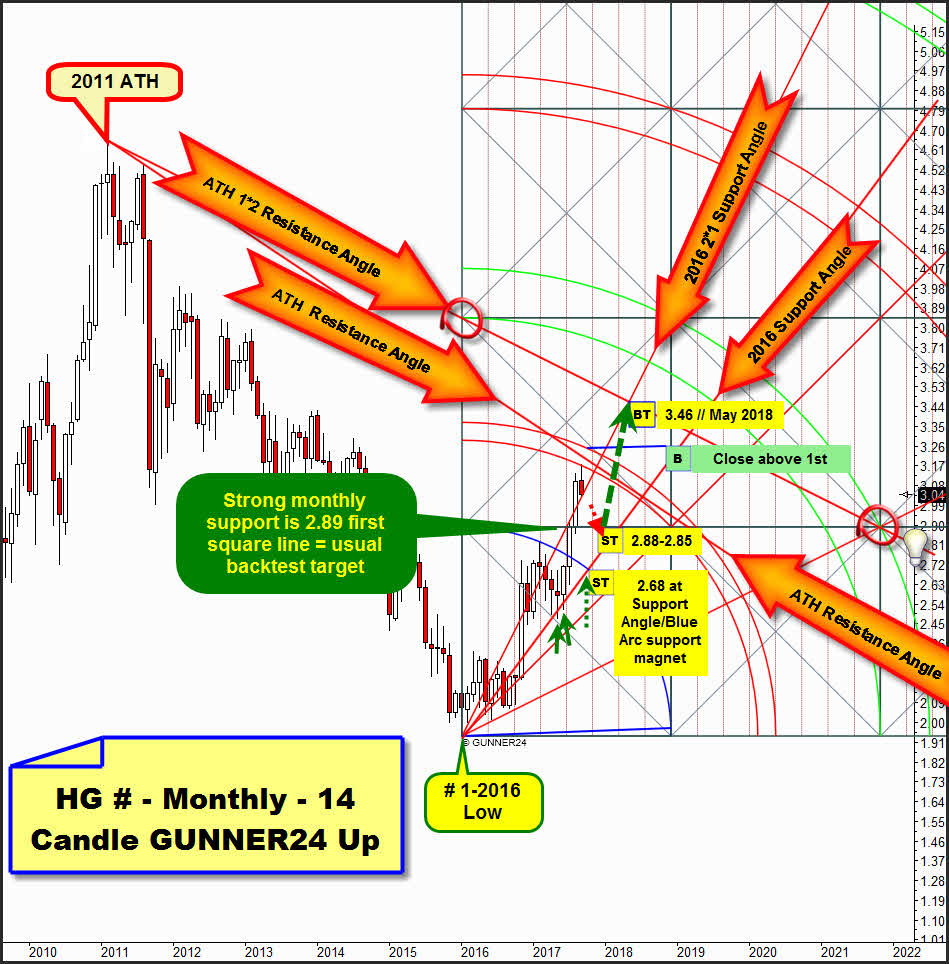
==> With 80% odds the next multi-month consolidation cycle has started. With an 80% odd 3.18$ is the final high of 2017! Consequently a re-test of the 3.18$ top - which perhaps might start in course of the next week - should A) be used to reduce long positions by large or B) should be used to open first shorts with a minimum downtarget at 2.88-2.85$:
IF the 2*1 Support Angle (at 3.02$ for September) fails to sustain, and that outcome is very likely cause intermediate top looks to be in and a new weekly downtrend just is at early stage, the very first monthly trail which should offer consolidation support is the 2.89$-first square line. After intermediate tops precisely made at a lower line of 1st the first square line is always minimum target for a "bounce". First square line is absolute normal backtest target for US copper and has to be worked off until December 2017/January 2018!
Normally - I suppose - the first square line will be traded and tested in each of the months October 2017 till December 2017/January 2018.
Likely is now that the first square line will become monthly closing base support till end 2017/early 2018, perhaps (lower likelihood...) the first square line will become month low support until end 2017/early 2018. In any case I expect lower copper quotations than a 2.89$ for the consolidation till end of 2017/early 2018 = small violation of the 2.89$!!
==> First downtarget is 2.88$-2.85$ and should be tested and worked off until January 2018! Means that this target even might be tested in course of September 2017!!!
Always when the monthly trend has changed and the former upleg was remarkable strong we have to recon with some deeper retracement targets to be achieved/tested back. Deepest I can foresee for the consolidation which will perhaps last into 2018 is a backtest of the 2.68$ support magnet. This very strong future support magnet is A) formed by 2016 Support Angle, which has held nicely at the 2 dark-green arrows and that was responsible support for the achieved summer lows and B) the Blue Arc.
The monthly 2.68$ support magnet is existing for the November 2017 candle, so there and then a consolidation cycle might form its final bearish extreme...
Best, cause most riskless entry into new longs is obviously any future test of the 2016 Support Angle because this rising Gann Angle is well-confirmed month low support and supported copper from 01/01/2017 up to day = 2016 Support Angle is rising support in the YEARLY TIME FRAME!
GUNNER24 Breakout Signal which finally activates the 3.46$ for May 2018 is the very first monthly close above the 1st double arc resistance which seems to be important combined monthly and yearly resistance trail!!
Be prepared!
Eduard Altmann


