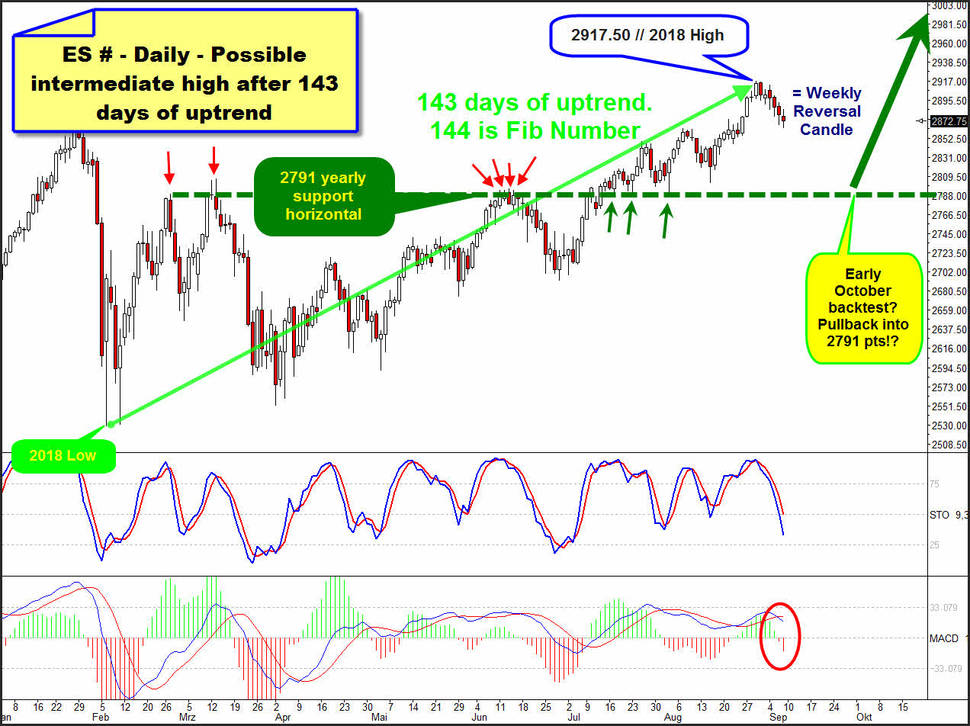
Furthermore, its interesting to note that the S&P 500 e-mini futures contract has a total of 143 trading days from the low of this year to the high of this year. I have sketched this strong and long cycle below in the following daily candlestick chart with the light-green upward arrow. Thus, the bull cycle of this year has obviously been based on the high important 144 Fibonacci number.
Since a visibly strong reaction to this important, natural potential trend turn number is seen, it is quite possible that at the 2917.50 pts annual high the in the GUNNER24 Forecasts of 08/19 pre-announced 3 to 5 week pullback cycle is on the way.
Every day of the past trading week closed in red and daily swing additionally makes bearish lower highs and lower lows pattern. The previous trading week has opened near week high and closed almost at the week low. In the end, the S&P 500 e-mini futures in the weekly chart nailed first Bearish Reversal Candle since the middle of June.
The just triggered MACD sell signal in the daily chart - see above again - implies that bearish pressure will continue to prevail for some more days resp. 3 to 4 weeks. I mean - and the GUNNER24 means that too - that the market will retrace to about 2791 points before the bull market is resumed ... within a quite normal pullback cycle... without much hectic and without panic! A healthy correction, which should find its final cycle low towards the beginning of October and close to the predicted 2791...
2791 is visible future horizontal support in the daily chart! 2791 was pretty well holding bear line for the entire first half of 2018. Attention, now I'll explain you the resolution why the 2791 is now a horizontal support in the yearly frame: Immediately after the beginning of the second half of the year - ie on time for the half-year change - 2791 was finally broken to the upside and was successfully tested back to the T for a total of 3 occasions at small dark-green arrows, thus the 2791 pts horizontal morphed to very strong future support for the rest of 2018 and beyond.
Since the 2791 is so extremely important for this bull market ==> nicely sharp defined and confirmed support! ==> this magnet of course could be tested again in the probably ongoing 3 to 5 weeks pullback cycle. And IF the 2791 horizontal support is retested in the further course of the year, this is the best = most strongest support magnet to open new long positions. In my opinion.
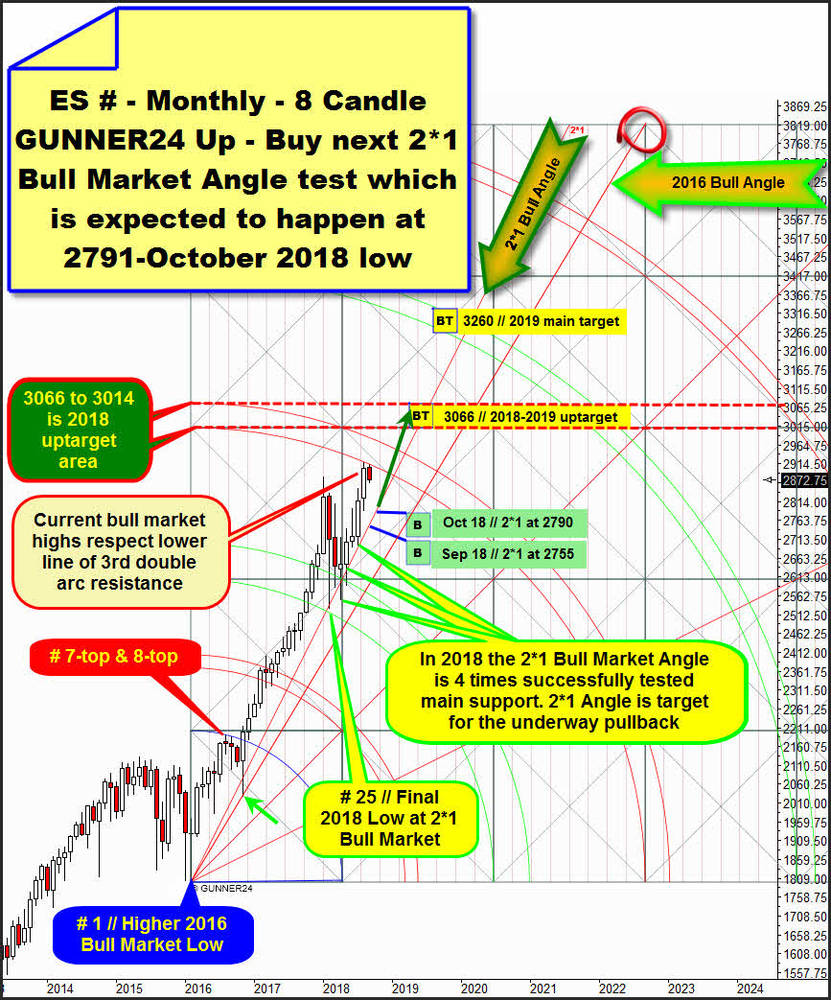
See also this very interesting picture in the monthly S&P 500 e-mini futures chart.
Monthly GUNNER24 Up Setup above starts measuring at last important higher bull market low which is # 1 // 2016 Low. Setup is a "textbook" 8 Fib number up and shows a special feature. Both, the final high of the 7th and the final high of the 8th month of the initial up impulse are linked or mathematically connectable with the circular Blue Arc, former resistance arc on monthly base.
In the next step lets watch the last two candles. Both, the August high which is current 2018 bull market high or alltime-high and the received high of current September candle which is small lower high compared to the alltime-high once again follow or respect a circular GUNNER24 Arc! This time the lower line of 3rd double arc radiates to the T resistance in the monthly chart.
So, the market at current bull market highs has reached natural GUNNER24 Bull Market arc resistance, which can be deduced from the first 8-month upwards wave. And at the same time - of course - achieved and worked off a very natural important bull market target 100% accurately on a monthly basis. Price has met time at 2018 highs. A change in trend is imminent! This signals the GUNNER24 View on monthly base! And it looks like a next pullback is confirmed by the recent bearish developments in the daily and weekly chart.
The probably started 3 to 5 weeks lasting pullback cycle would have to be able to test one more time the most important rising support in the monthly chart. See above... This is the important 2*1 Angle originating from the # 1 // Higher 2016 Bull Market Low.
==> In course of 2018 the 2*1 Bull Market Angle was tested at 4 occasions, including this year`s low test. Cause the # 25-February 2018 low with a 99.99% probability will be the final low of entire 2018, the 2*1 Bull Market Angle is additionally a rising support on yearly base. It`s most nearest and most imaginable strongest future support for the S&P 500! and quite normal pullback target or downtrend support magnet until first monthly close below 2*1 Angle is fired which would be a very serious monthly sell signal.
==> Any next test of 2*1 Bull Market Angle is Gentleman`s long entry. Above I`ve highlighted the "Best Buy" or course of the 2*1 Bull Market Angle for the current September (Sep 18) and the next October 2018 (Oct 18) candles.
For Sep 18 the 2*1 Angle support resides at 2755 pts. ==> For me, it is unimaginable at the moment that the possible underway downtrend will accelerate so much that he will reach the 2*1 Bull Market Angle in course of September. That would be extreme and extreme surprising sales panic that would have to kick in there yet.
But of course it would be just logical if the 2*1 Bull Market Angle will be tested sometimes in course of Oct 18, perhaps at final Oct 18 lows, because then the 2*1 Bull Market Angle runs - what a surprise - precisely at 2970.00 pts.
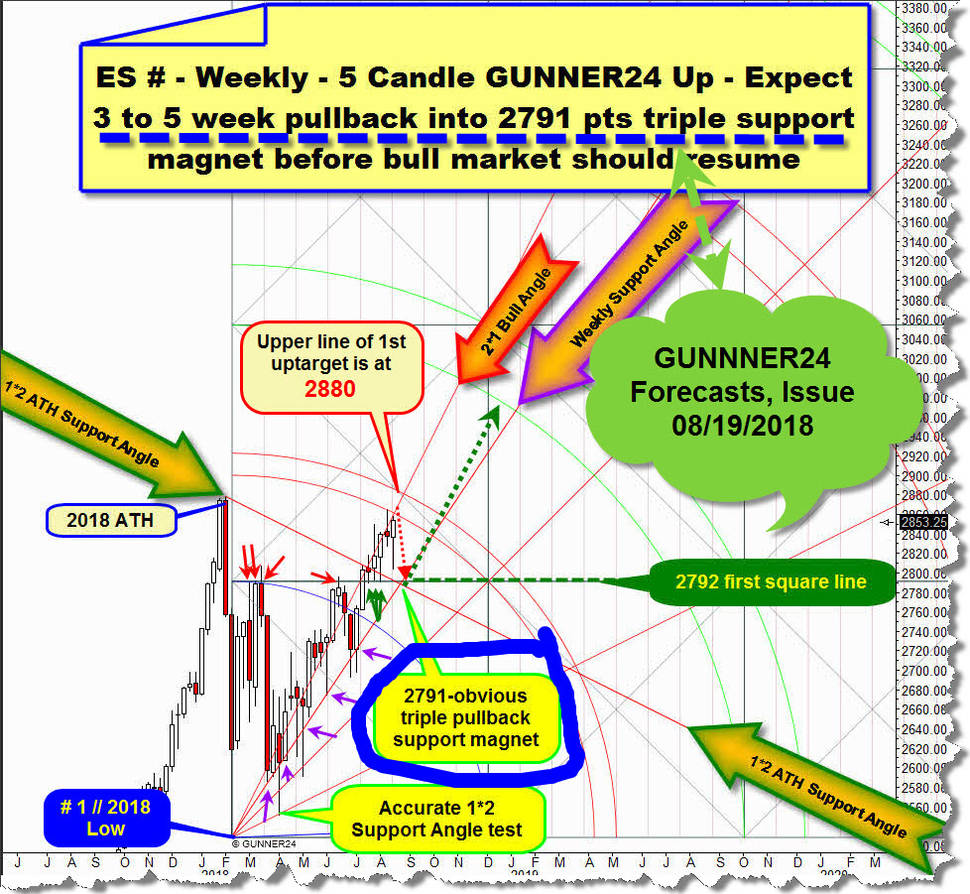
And then there is additionally the future triple magnet support in the weekly chart that can be worked out exactly at 2971 pts. Means, the 2971 is also magical support or magical pullback attraction price in the weekly time frame.
I did this job 3 weeks ago. Within the free 08/19 GUNNER24 Newsletter Forecast...:
Thus, 2791 pts is combined daily & weekly & monthly & yearly GUNNER24 Support Magnet.
This is very rare support combination that we have identified. Thus, insanely powerful, almost unbreakable GUNNER24 Support Magnet which should be bought until middle of October 2018 IF reached or tested within likely underway 3 to 5 week pullback cycle!
Be prepared!
Eduard


