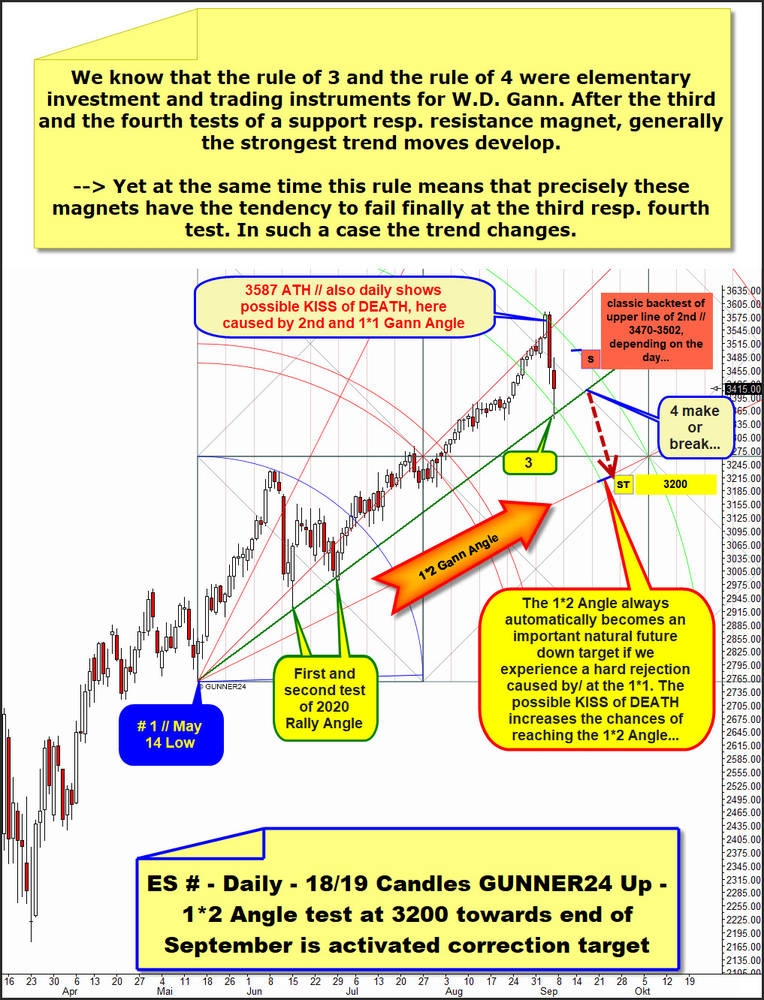
Of course the uptrend on daily and weekly base technically remains in place but unless the just fired correction signals are not fast and above all, fully reversed, we have to expect that a downwave should to last about 4 to 5 week candles and S&P 500 should hit the 3200 pts towards end of September.
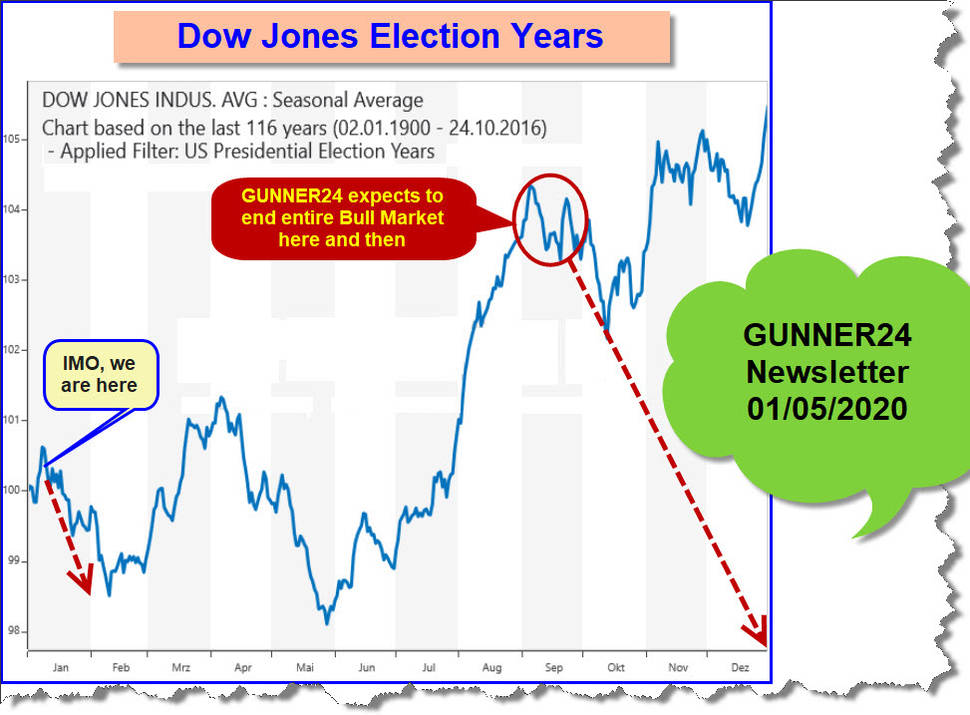
In the very worst case this longest stock bull market ever has now topped finally, as pre-announced on January 5th here at this place. Click here on blue link or on the seasonal chart.
Then I predicted that the very last bull market rally would take the S&P 500 to around 3550 points by September and October. Starting from the major important February/March 2020 cycle low ...
So much for the possible importance of this week made highs. The alltime-high of the S&P 500 index came in on September 2 at 3588.10. The S&P 500 e-mini continuous futures contract (ES #) topped the same day at 3587.
Now that a more mature correction may be underway. And in the best case a new bear market – possibly running for at least 5-6 months – is triggered, we want to seize upcoming chances to the short side.
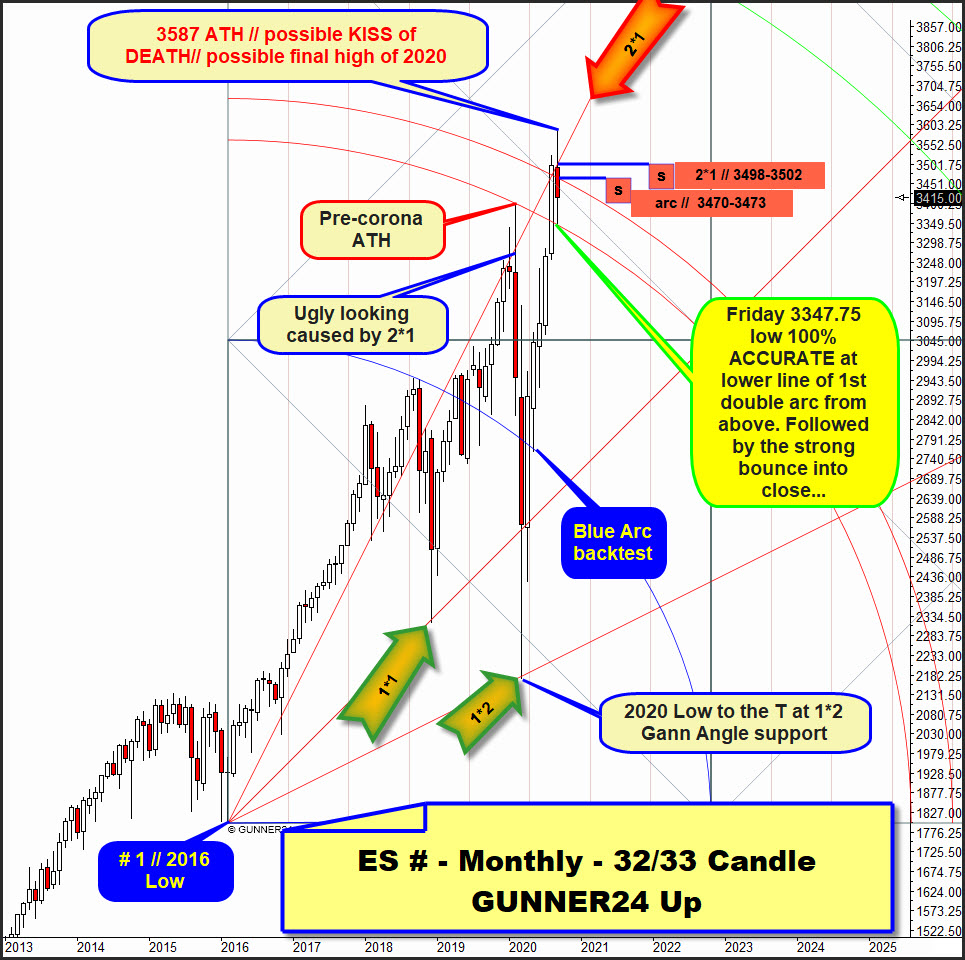
For this purpose, we would first like to look at the monthly developments. With the help of this monthly 32/33 GUNNER24 Candle up setup of the ES #, which we have been working with for a long time. Therefore, I want to focus only on the developments of the last few weeks:
2020 rally cycle started at 100% accurate successful backtest of the 1*2 Gann Angle and 2020 Low and rally went nearly vertical into August and September highs which were printed above the upper line of 1st what is natural mathematical uptarget as the lower line of 1st became confirmed major important magnet by 2020 pre-corona alltime-high (ATH).
Rule: Whenever the lower line of a double arc has been recognized as important in the past, the upper line of this double arc will automatically become important. Regarding price and time.
The importance of the 2*1 Gann Angle (main bull market resistance upmagnet) was again confirmed at the year highs because this September 2020 opening auction is printed shy below the 2*1 Gann Angle. Since history repeats neaerly never 1 to 1 but often rhymes, a KISS of DEATH triggered by the 2*1 Gann Angle and a line of the 1st double arc may have fired again as it was already the case at the pre-corona alltime-high. At that time the lower line of 1st double arc and the 2*1 Gann Angle resistances combined have triggered the fastest, the sharpest and hardest sell-off ever.
Or, the behaviour seen at upper line of 1st = possible major resistance and 2*1 Gann Angle = possible major resistance combined, could have triggered A) the final high of entire 2020 and B) the next bear market and therefore C) the next KISS of DEATH or the next major monthly sell-short signal.
The lower line of 1st STILL is major important rail for the market as the 3347.75 pts Friday low 100% accurately tested that monthly support from above!
This at first stage very successful backtest of the monthly lower line of 1st double arc support lead to the positive reaction into 3415 pts Friday close.
This leads to the following trading and investing conclusion: If the Friday lows should be undercut by about 5 pts in the course of September, this is probably a mighty strong sell-signal on monthly base. Because then the important monthly support of the lower line of 1st likely would be broken finally. In such a case the price should drop hard in further course!
This setup above fires 3 major important future resistances.
First, of course, the 3587 pts is major resistance (horizontal) and any future price above is next big MAJOR buy signal.
Second, the for the September strongest future resistances are A) the 2*1 Gann Angle resistance and B) the upper line of 1st double arc resistance. Both are major backtest magnets for the rest of September.
==> The 2*1 runs at 3498-3502 pts for the September 2020 candle. The upper line of 1st is located at at 3470-3473 pts.
In my opinion there is a good chance that at least the upper line of 1st at 3470-3473 will be tested again. Usually sometimes in the course of the next week. This is my first sell-short recommendation:
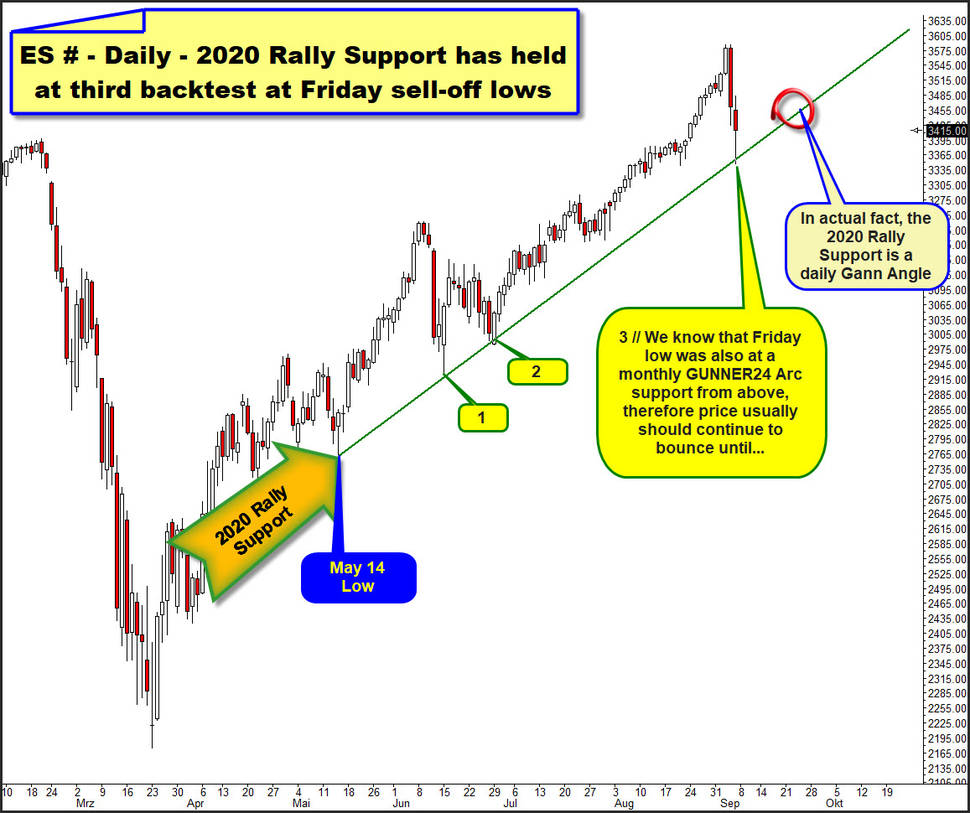
Above is the daily candlestick chart, presenting the most strongest and most obvious 2020 bull market support what is the dark-green line. This well-defined rail springs from May 14 pullback low and was tested for the third time at Friday spike lows.
From the beginning we know that the Friday low was at a monthly support arc from above. So, consequently the Friday low at same time was at a big daily support and a big monthly support.
Thus in our terminology, a combined daily and monthly support was successfully tested at the same time. => Friday sell-off low was at a combined daily and monthly support magnet.
And this is why I think the markets have to continue to bounce the most part of the next week!
=> until about there:
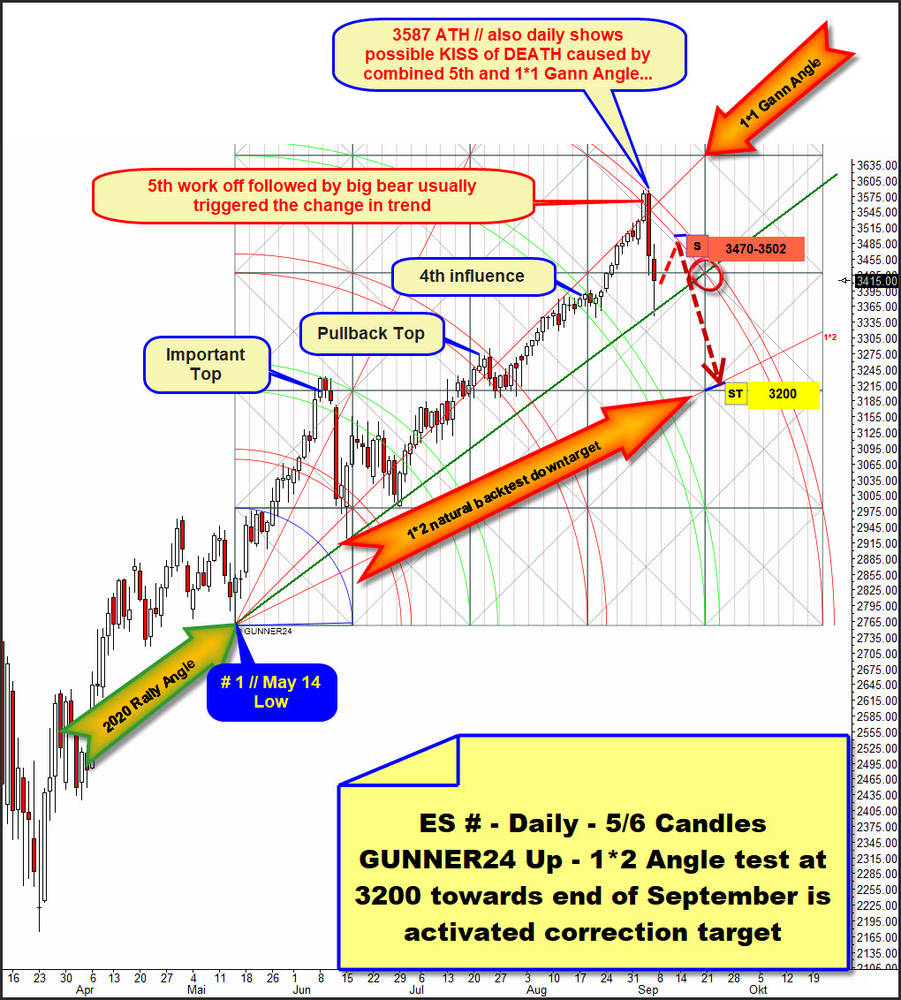
Until the 5th double arc is reached again in bounce direction within this daily 5/6 Candle up, IMHO.
The final work off of the 5th double arc – always main targets for stock markets – triggered the so far 2 day sell-off. Therefore its a confirmed and very important = strong future resistance and therefore the ideal backtest resistance magnet for an uptrend in course of next week.
Unfortunately, as things stand today, it is not possible to work out on which day and where exactly the 5th double arc daily main resistance/ideal bounce magnet could be tested back. But for sure we will see, IF the bounce continues, that the 3470 to 3502 is not only an important monthly resistance zone but also should radiate some resistance on a day-to-day basis!
We also keep in mind that the 3470-3502 pts area is combined daily & monthly GUNNER24 Resistance Magnet for the next 5 to 7 trading days or so. And such a combo is ALWAYS very serious resistance stuff to overcome.
The downtarget to forecast is easy stuff. The 1*1 Gann Angle (resistance) together with the 5th natural main uptarget together triggered a KISS of DEATH trading setup.
... therefore we have 2 individual KISSES of DEATH setups at the same time. One on daily base. And the monthly based KISS of DEATH ...
... with the natural downtarget of 1*2 Gann Angle what could be tested at the 3200 pts towards end of September to early-October.
Strongest daily attraction below current quotations is the 1*2 Gann Angle (perhaps strong future support) out of May 14th pullback low.
Of course the uptrend on daily and weekly base technically remains in place, but it will be broken finally when the 2020 Rally Angle gives way at possibly due fourth test.
I would like to outline this possibility with the help of this daily 18/19 Candle up, that we can also create at the # 1 // major important May 14 pullback low:
Also in this setup the alltime-highs have
arrived very close to a natural important bull market uptarget. Here at
the upper line of 2nd double arc. Also in this up setup no daily
closing price above the upper line of 2nd double arc was allowed to
print. This is therefore also an important future resistance arc on
daily closing and day high base.
And of course also this setup fires the KISS of DEATH setup with main
target 1*2 Gann Angle at 3200 pts.
Our refresher regarding the rule of 3 and 4 is that the rule of 3 and 4 was an elementary investment and trading instrument for W.D. Gann. He was the first who recognizend that after the third and the fourth tests of a support resp. resistance magnet, AND especially all THE IMPORTANT Gann Angles (1*2, 1*1, 2*1, 1*4 etc.) generally the strongest trend moves develop.
Yet at the same time this rule means that precisely these magnets have the tendency to fail finally at the third resp. fourth test.
That`s why the just seen third test of the 2020 Rally Angle should lead to a bounce continuation towards 3470-3502 sell-short Gentleman`s entry. And that`s why the perhaps next due test of the 2020 Rally Angle is a major important one.
IF 2020 Rally Angle fails to support in course of the next up to 7 trading days we have strong confirmation that a correction should test and reach at least the 3200 pts downmagnet until end of September 2020.
In turn, either just printed third test of rally support or perhaps soon due 4th test of the 2020 Rally Angle deliver next higher bull market low/lows, followed by another multi-week long rally cycle!
Be prepared!
Eduard Altmann

