NUGT is a 3x leveraged Bull ETF, designed to move of three times the price movement of its target index, the NYSE Arca Gold Miners Index (GDM).
2x, 3x leveraged leveraged Bull ETFs and their counterparts, the invers leveraged Bear ETFs are mere swing-, day-trading- und intraday-instruments, maximally suitable for a duration of some few weeks, at most 2-3 months, imho.
They were issued to constantly nickel and dime investors.
Their construction promises easy + quick twice or even thrice levered profit. However, if the market participant lose sight of the position and the trend because of not always being able to trade, for instance in case of part-time traders and part-time investors or during extensive vacations, those killer ETFs often elope. Painful losses grow.
==> Today, I’d like to suggest you the possible bear market low for NUGT in terms of price and time. It might be brought in at 1.78$-1.85$ in the present September. The GUNNER24 Trade Setup presented today promises altogether +1000% upwards potential till spring 2016. So, the trade will have to be monitored most rigorously, because the investment horizon for this ETF is actually too long. Within the investment period you should be funneled to trade only the up swings, hence in case of obvious intermediate highs even up to enter again with possible intermediate lows.
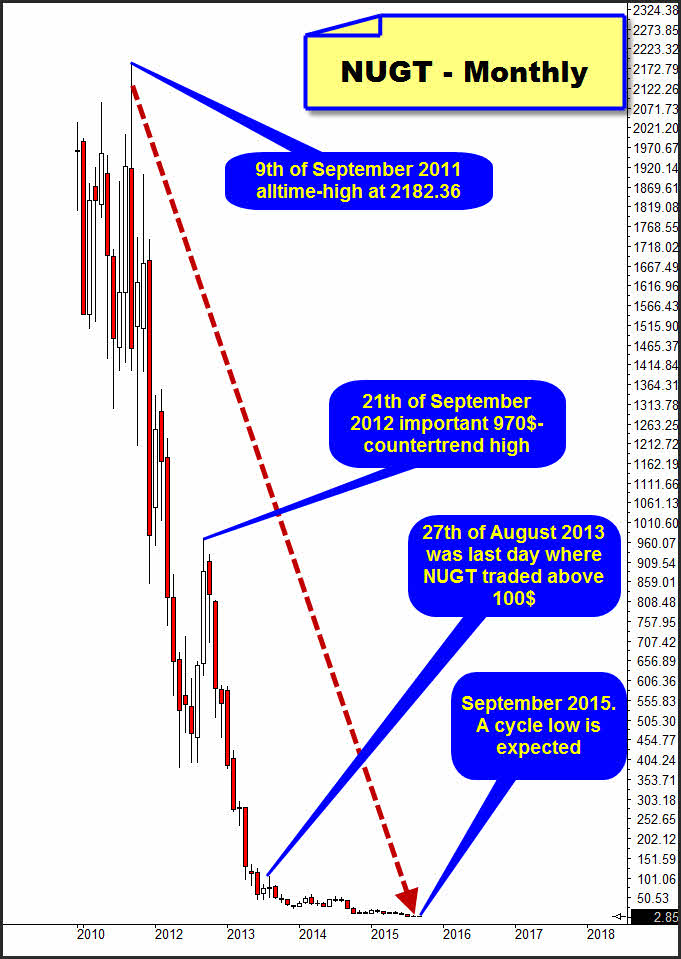
NUGT was issued on time towards the near end of the gold bull in December 2010 topping with gold and the gold miners in September 2011 into the 2182.36$ alltime-high.
I cannot imagine at all that there are still people yet holding NUGT long-positions now that were built up in the years 2010 and 2011. Either those positions had to be evened up the last years, or the people would have to dash down the roof one day…
From the alltime-high till today, NUGT has lost 99.87%. No findings result from the monthly chart if I apply the GUNNER24 Setup. Just the weekly time frame reveals some important information on the expected intermediate bear lows. Yet very interesting is the importance of the month of September regarding its extrema.
Since in September 2011 the alltime-high was generated, now after exactly 4 years, the market might generate the first important respectively a most important bear low within an 8 year cycle:
The 8 year cycle often plays a dominating part in gold and the gold miners. Consequently also for NUGT this 8 year cycle would have to be meaningful respectively valid. After exactly 4 years, exactly in the middle of the 8 year cycle that starts at the alltime-high, being due an important bear low is suggested by itself now.
Additionally, in September 2012 an important countertrend high at 970$ was marked. This one was unable to reached/test back the round 1000$ Gann Magnet that had been smashed a few months before.
August 27, 2013 was the last time NUGT traded above the "round" 100$. The moment of this event is extremely near to September.
So, September seems to be/become important for the gold miners. Technically, the gold miners are supposed to bottom finally in the period of July till October 2015. This is what I illustrated several times already at this juncture with the aid of the HUI. See here and here.
==> Let’s analyze now the NUGT in the weekly time frame regarding both co-existing valid GUNNER24 Down Setups. The first relevant one starts at the important countertrend high of the year 2013. The other one can be applied at the final high of the year 2014.
==> As very first step, I’d like to show you the anchoring of the Gann Angles that are currently most important for NUGT - for both setups swiftly in succession. Whenever we realize that price respects the Gann Angles, we can be pretty positive that our scaling in terms of price and time axis suits. This again is the precondition for evaluating important changes according to price and time after all!
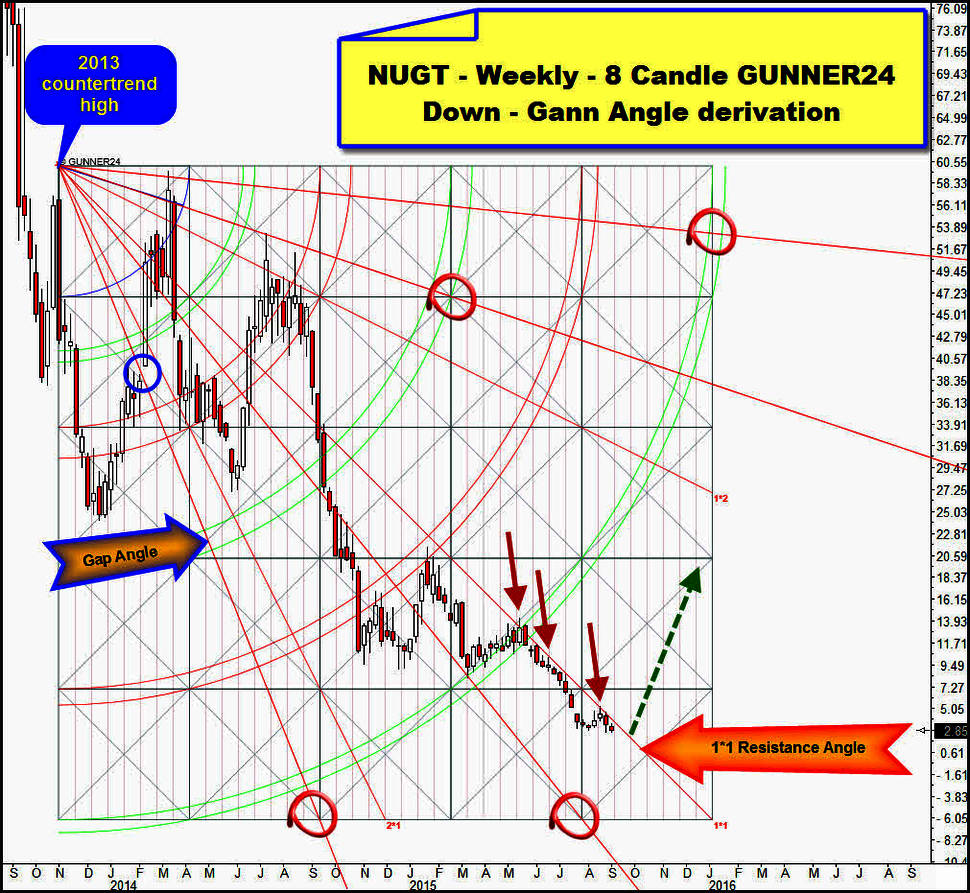
Weekly 8 Candle down, applied at the 2013 countertrend high:
What is to be highlighted here is that we can identify an angle that was responsible for a weekly opening gap (blue circle) and of course the realization that since May 2015 NUGT has clearly been following the down pressure of the 1*1 Resistance Angle = red arrows!
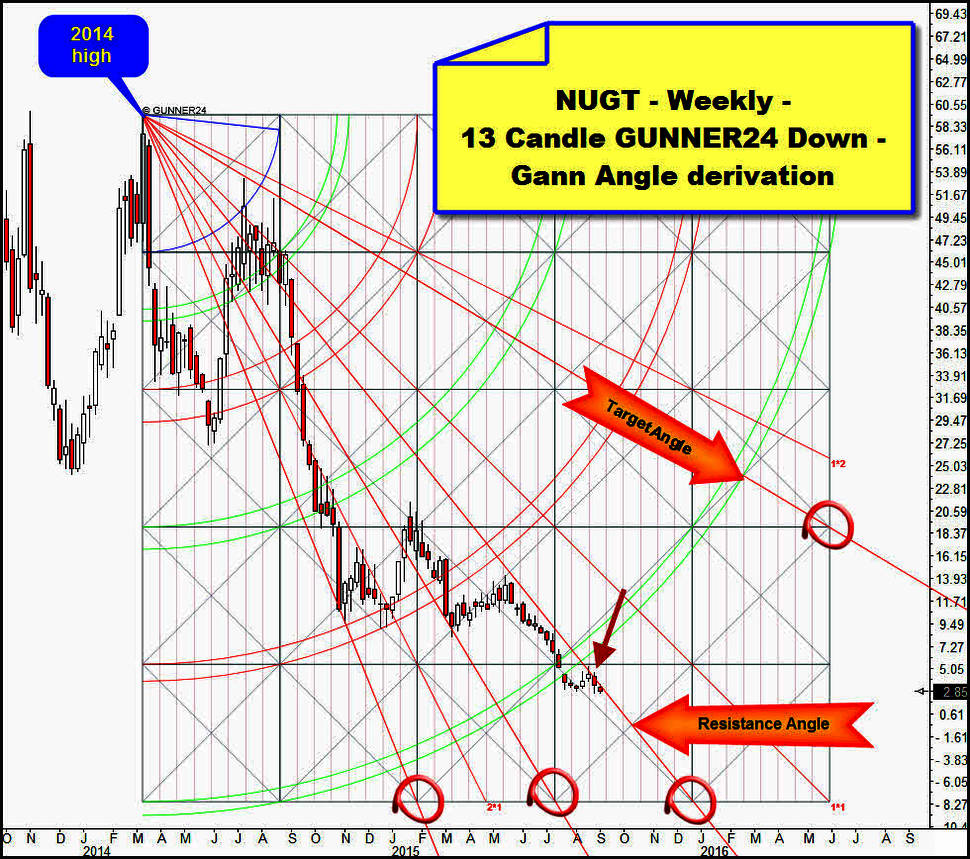
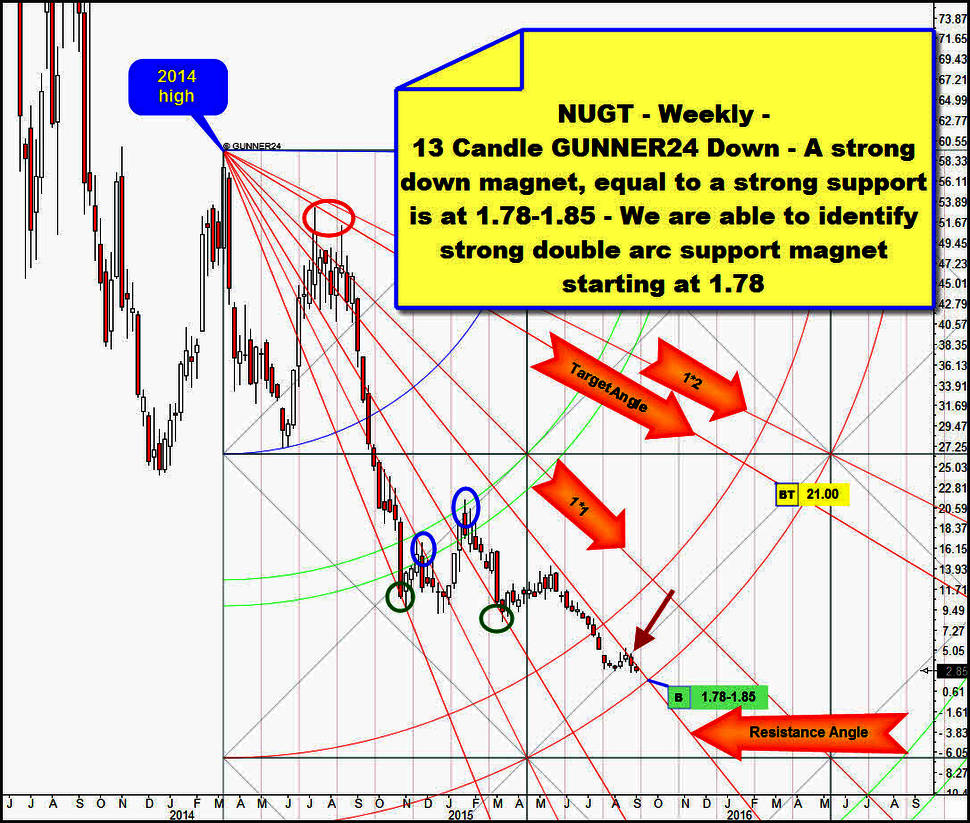
Weekly 13 Candle down, applied at the 2014 high:
Most important recognition here is that now also the Resistance Angle starting from the 2014 high is pressing down NUGT. Watch NUGT at red arrow. NUGT is thereby simultaneously being subject to the combined downwards pressure exerted by the 2013 countertrend high and the 2014 high.
If this combined angle down pressure is dissolved upwards, NUGT will finally be supposed to go up substantially. An upwards target is to be seen above, anchored at the right margin, the Target Angle!
Now we draw down the Blue Arc, correctly by 8 respectively 13 candles into the individually important initial down impulse lows…
The 8 Candle down:
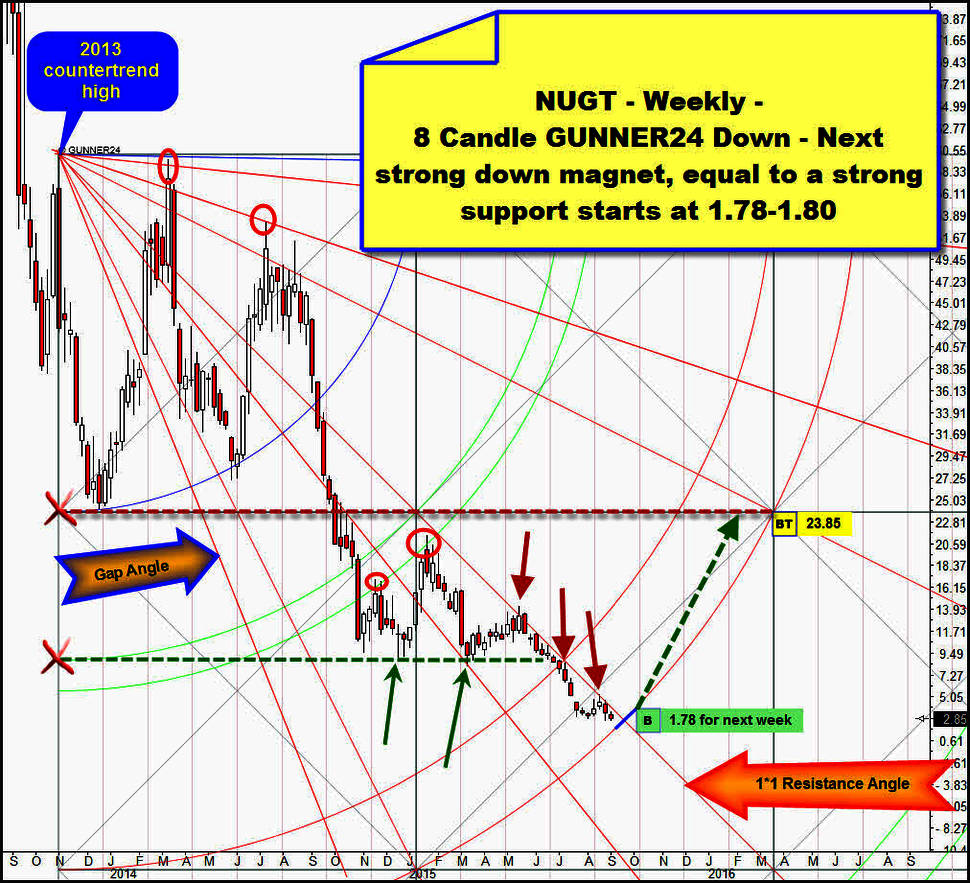
Lose to the red ovals you see now the hits at the previously identified Gann Angles and at both backtests of the prior broken 1st double arc. Since the 1st double arc is finally broken, the upper line of the 2nd double arc became the next downtarget. Important bear market lows were marked at the GUNNER24 Support Horizontal that starts at the intersection point of the upper line of the 1st double arc with the beginning of the setup. For this, watch the 2 green arrows.
Since the upper line of the 2nd double arc is broken downwards and furthermore the Support Horizontal was broken finally, now the lower line of the 2nd double arc is the next lower downtarget for NUGT.
Since the 1*1 Resistance Angle has obviously been pressing down NUGT since May 2015, a touch with the lower line of the 2nd is to be expected for next, at the latest for the trading week after next.
The lower line of the 2nd double arc takes course at 1.78$ next week. If NUGT overcomes the dominating and currently overpowering resistance of the 1*1 Resistance Angle after the touch with the lower line of the 2nd double arc twice in a row on weekly closing base, we’ll have the confirmation that the important bear low shall have been made in September 2015. In succession, NUGT is supposed/able to rise up to the first square line resistance = 23.85$ till January/February, perhaps not before the beginning of March 2016. 23.85$ is main target for the trade setup.
The 13 Candle down:
At the red and the green ovals, there are the hits at the previously identified Gann Angles.
Just like in the 8 Candle Down, we newly recognize two important negative tests at the prior broken 1st double arc. For this, watch the two blue ovals.
Since the 1st double arc is finally broken, the upper line of the 2nd double arc became the next downtarget. Since the upper line of the 2nd double arc is broken downwards, now the lower line of the 2nd is the next lower downtarget for NUGT.
Since the Resistance Angle is obviously pressing down NUGT now, a touch with the lower line of the 2nd is to be expected for next, the week after next, but at the latest in 3 weeks. The lower line of the 2nd double arc takes course at 1.78$ in three weeks.
If NUGT overcomes the dominating and currently overpowering resistance of the Resistance Angle after the touch with the lower line of the 2nd double arc twice in a row on weekly closing base, we’ll have the confirmation that the important bear low shall have been made in September 2015. In succession, NUGT is supposed/able to rise up to the first square line resistance = 21.00$ till January/February, perhaps not before the beginning of March 2016. 21.00$ is first target for the trade setup.
==> Maybe you realize…? …I really just copy from the text above. The structure of downwards moves from the 2013 countertrend high and from the 2014 high is virtually identic!
==> In addition, together with the 8 Candle down, the 13 candle down features almost simultaneously the same double arc support = lower line of the 2nd double arc at the 1.78$-1.85$ environment for the most likely turning month of September 2015. Thus, we can identify a strong double arc support magnet, starting at 1.78$ in the weekly time frame! From there on, NUGT is technically supposed to be able to start an extreme bull run into the 21.00$-24.00$ first respectively main uptarget! This trade setup has enormous +1000% upwards potential!
If you want me to, I will adjust for you the soon due NUGT long entry with the aid of some further time frames by means of the GUNNER24 Method very keenly = when and where will the entry have to be implemented?! And I’ll trace, monitor, pyramid the long-position/long-positions of this potential "Trade of the Year" for you personally: In our Trade of the Day service!
Be a part of our exclusive sworn GUNNER24 Trader Community – now... I try to protect your wealth!
- with daily trades – quick, safe and profitable…
- in well-chosen precious metals, commodities, indexes, currencies and in the best stocks worldwide...
- in both rising and falling markets…
- with little use of capital…
Be prepared!
Eduard Altmann

