In the end nearest traded Gold futures contract has reached 1167.10 and bounced strongly from there. We have now satisfied the minimum requirements for a completed downtrend in both the weekly and the monthly charts.
What it additionally needs in the short and medium term to regain confidence in the gold, which technical obstacles should be overcome by when, I'll show you today.
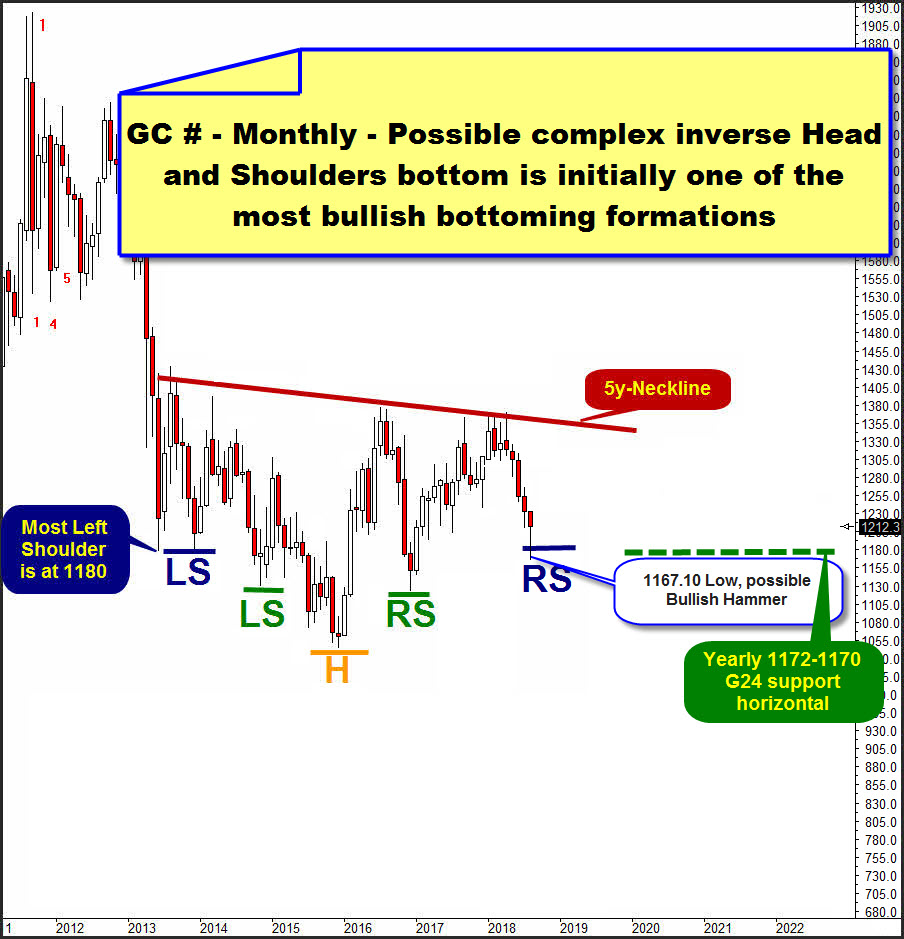
There’s shoulder symmetry being anticipated onto this monthly Gold future continuous contract chart. That left and right shoulder symmetry occurring in the late stages of a giant complex inverse Head and Shoulders bull continuation pattern. It takes many years for these patterns to form and be completed.
Anticipated Most Right Shoulder (blue RS) support is existing at 1180 and has the origin in the Most Left Shoulder (blue LS) support. Consequently, the 1180 is a horizontal support existing in the yearly time frame.
At the same time the 1180 is or was a downmagnet on combined monthly & yearly base and during the recent stronger and stronger accelerating downtrend it emerged that both this important yearly 1180-chart pattern objective as the well-known GUNNER24 Support Horizontal running at 1172-1170 should be tested in the 2018 downtrend cycle.
MAJOR 1172-1170 GUNNER24 Support Horizontal derives directly and automatically from 2011 alltime-high. Means, this is also resp. was quite normal important downmagnet objective for the downtrend which was triggered by 2018 Top.
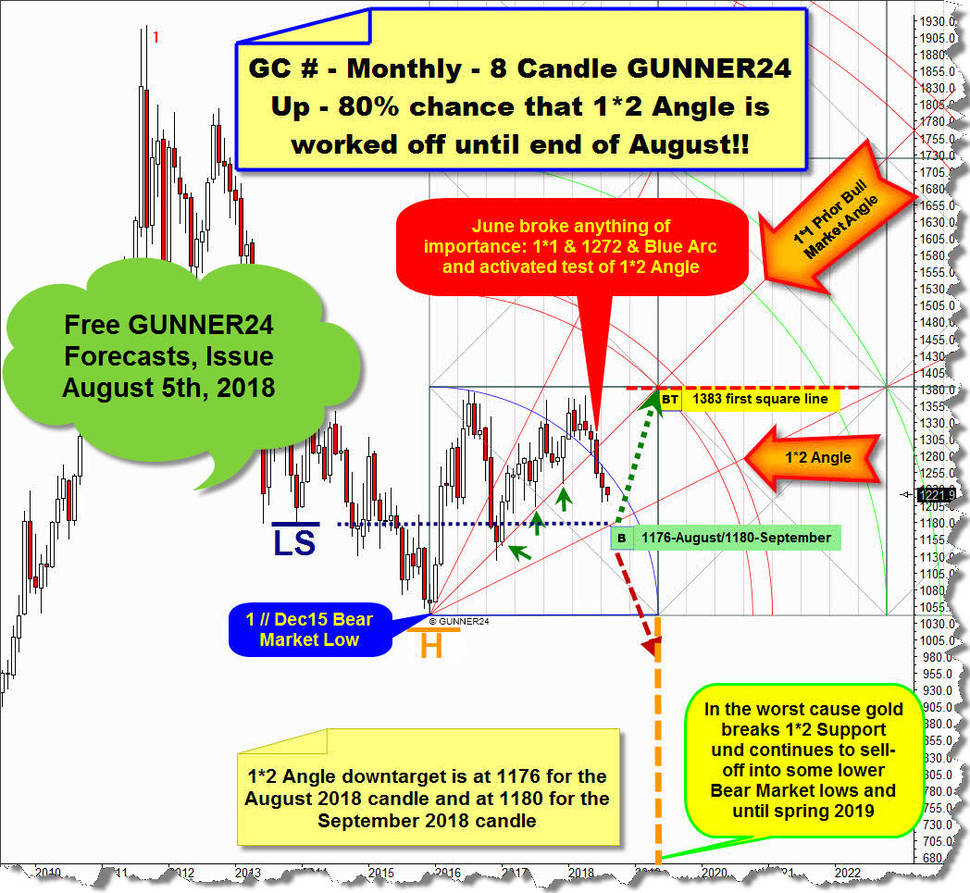
Another Big attracting Support existing in the yearly scale is 1*2 Gann Angle (look down...) out of Dec15 Bear Market Low, the lowest gold price since 2y and 9m. That 1*2 Support Angle runs at 1176 for the current August 2018 and became activated important Gann Angle downtarget after 1*1 Prior Bull Market Angle out of Dec15 Bear Market Low (look down...) was fallen short at June 2018 mega bearish close:
All of these obviously important downtrend magnets and initial yearly support magnets, taken together and put together, had to pull the gold price irresistibly, resulting in the simple logical conclusion that the IDEAL summer 2018 doldrums low and perhaps!!! FINAL gold trading low of the year 2018 usually should be expected at round about 1172-1180, either at possible final August 2018 and/or at possible final September 2018 low.
Well, it bottomed at 1167.10 on August 16 and began to rally in the daily time frame. Thus, gold turned exactly there and then where it should = price has met time!, followed by a first quite strong counter-reaction, and this has led to the fact that the structure of the current August candle presents itself quite bullish.
At the top you can see the updated monthly gold candlestick chart, together with the 8 Candle up starting at # 1 // Dec15 Bear Market Low accompanying us for years.
The daily trend has changed at yearly triple support magnet and points further upwards cause Friday was the second best performing gold day of entire 2018. The daily trend is now up, that`s why gold has created the requirements to fire an initially bullish August candle with just 1 week to go until month end auction.
Perhaps a bullish Hammer Candle is in the making now, which would normally be a very bullish sign for an intermediate low made at 1167.10 and, of course, a serious indication that gold has hit 2018 bottom at its yearly triple support magnet.
The odds of gold continue turning up here are hugely enhanced by its latest COT and sentiment data. Its latest COT data shows that the Large Specs actaully started going short gold. This must be viewed as exceptionally bullish because the Large Specs are overall always wrong.
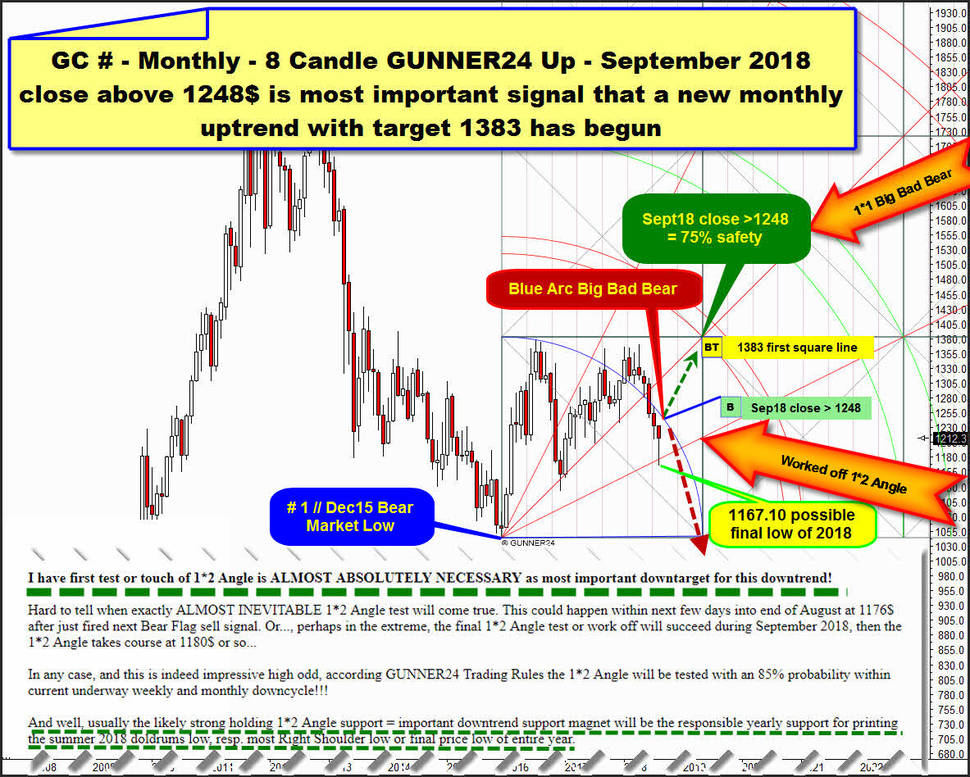
==> This bullish COT conspicuousness plus all the bullish signs the gold fires now in the monthly chart together with the experience from the past, that September is overall always in the Top 3 of the best performing months for the gold can only lead to a logical consequence, namely the gold next, and probably already in the course of September 2018, will, or must test back the Blue Arc highlighted above in the 8 Candle up!
Blue Arc is most important nearest yearly resistance above. Blue Arc is Big and Bad Bear threshold for 2018. The nearest annual resistance above is the well-known 1222 GUNNER24 Resistance Horizontal.
==> For September 2018 candle falling yearly Blue Arc resistance upmagnet is at 1245 and with an 80% probability will be tested and work off until end of September 2018.
==> And at the very earliest, if gold succeeds in recapturing the Blue Arc on a monthly closing basis with a September 2018 close of around 1248, long-term investors and mid-term oriented traders can be quite sure that the gold has started a new uptrend in the monthly chart which should test future 1383 triple upmagnet in course of winter 2019 with a security of 75%.
Only the awaited Blue Arc Big Bad Bear backtest is likely to give clarity what gold actually intends this year:
A negative backtest of the Blue Arc at September/October highs should lead to a backtest or overall second test - at least!!! - of the "Worked off 1*2 Angle" = yearly support with the prospect that this angle support will then break and gold will close the year 2018 bearish at ist annual lows, followed by a test of the bear market lows in the course of 2019.
==> A first decisive monthly close below 1*2 Angle is next Big Bad GUNNER24 Bear Signal and activates lower bear market lows in further course of 2019.
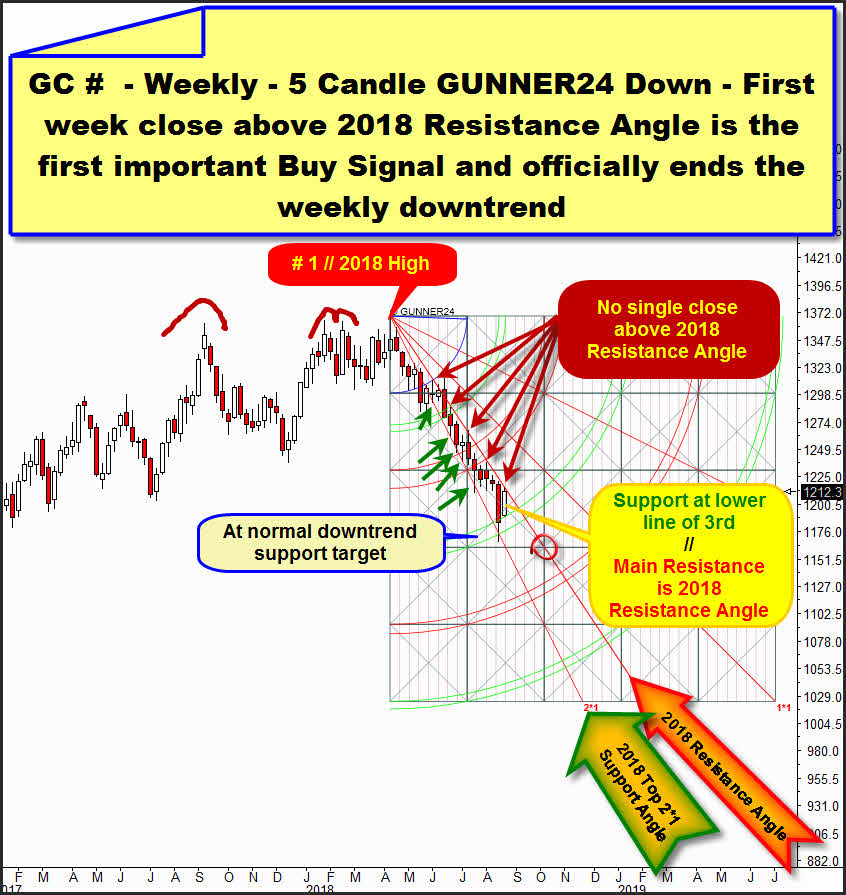
On weekly base so far no buy signal has been triggered! This can happen at the earliest with the close of the upcoming trading week ...
Above you find the current only valid weekly GUNNER24 Down Setup. 5 Candle down setup, starting at final high of 2018. Within downtrend which began at # 1 // 2018 High after mega bearish Triple Top the gold broke 2nd double arc support finally to the downside and this was another heavy downtrend continuation signal, so 3rd double arc became nearest activated downtrend target in this time frame.
3rd double arc above = an activated weekly target, together with the yearly 1172-1170 GUNNER24 Support Horizontal and the 1176 1*2 Support Angle out of 2015 Bear Market Low + the yearly Most Right Shoulder support has formed combined quadruple support magnet for the month of August 2018.
As clearly seen in the weekly chart above, the 3rd double arc support has been reached at 2018 downtrend lows and thus a very important downside target has been worked off. The 3rd double arc area is now clearly supporting the gold in the daily bounce, as the open and at the same time the low of the last week is exactly at the upper line of 3rd support.
==> 3rd double arc above is now confirmed rising support on weekly base, therefore the next test of the 3rd should be bought!
However, the trading range of the last week candle still traded in the so far still dominating downtrend channel, which is defined from above by the 2018 Resistance Angle, which of course can be anchored in the setup, and from below from the 2018 Top 2*1 Support Angle.
That's why: Only the very first weekly close ABOVE the 2018 Resistance Angle officially ends the current weekly downtrend cycle and triggers a trend change from down to countertrend, whose main target is 1245 monthly Blue Arc which with an 80% odd will be tested and worked off in course of September 2018.
Be prepared!
Eduard Altmann


