The trend is your friend, says a tried and true rule of thumb in trading and investing. The big question the attentive investor of stocks and so is asking himself just now is: "and which is the trend being"??!! Whereas the most important European stock indexes are presenting themselves in a weekly confirmed downtrend preparing their next hefty down-waves and thereby hardly being supposed to even sniff in the summer 2014 peaks when the year closes…
…the EU stock-market rally is not going to gather pace substantially before Draghi carries out his "threat" uttered during the Jackson Hole meeting that the ECB would virtually flood Europe with cheap Euros in order to cushion the inexorable recession and deflation development for the Euro area. Probable stretch for the final dam break of the Euro including further interest rate cuts and massive purchasing of bonds/securities by the ECB will be about mid-October 2014…
…the S&P 500 and both tech indexes NASDAQ-100 and NASDAQ Composite open one snaps keg after another keeping on swaying uphill under dangerously low trade volume – it’s still summer time after all, and from beginning of September the Big Boys will be at the trading desk again.
In a hazardous way, the three mentioned party indexes are diverging from the other important US benchmark indexes such as Dow Jones, Dow Transports and Russel 2000, the latter already going in sympathy together with Europe’s development. The Dow Jones is most likely to have topped out as early as 07/17 at 17151.56 – see GUNNER24 Forecasts, issue 08/03/2014 – in terms of price, being actually expected to just approach its previous top again. So a double top is likely to occur.
Then, the Dow Transport will diverge again from the Dow Jones because it is most likely to reach a small higher high again before changing the swing of its correction move. The Russel 2000 is anyway up the spout already being in the correction mode.
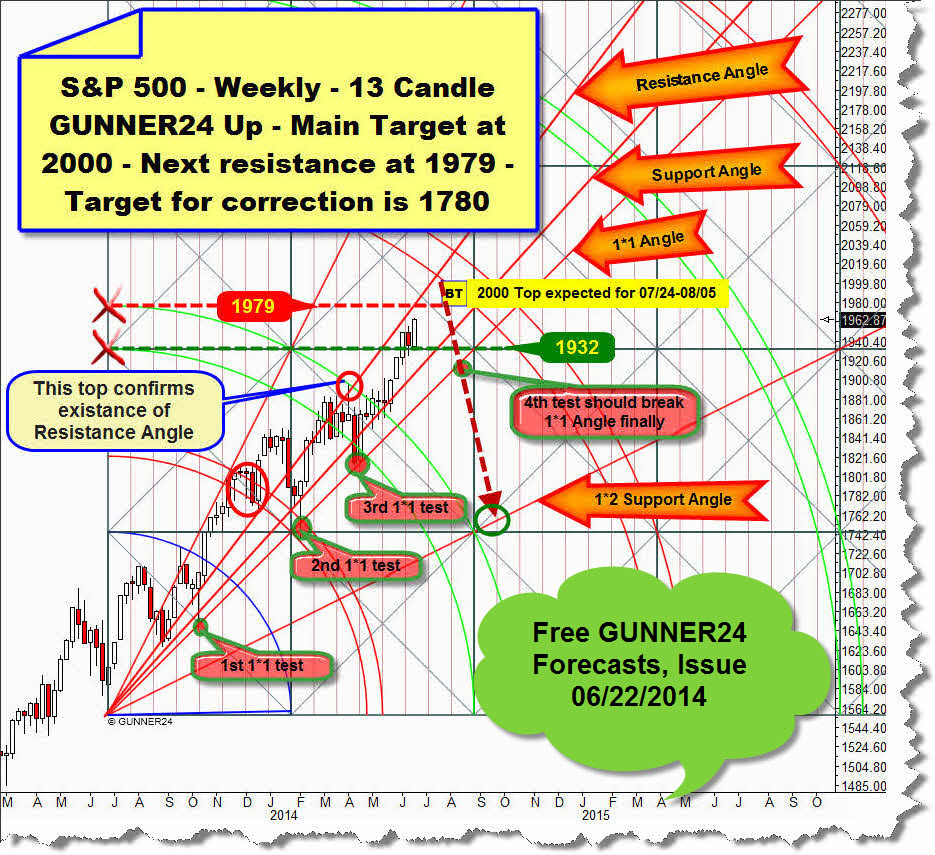
The S&P 500 would better have begun to correct from July, together with the European Indexes and the Russel 2000, as to my hunch, but the 2000 pts. will certainly have to come. That’s what the market wants conceivably since about April/May:
I don’t know – this extremely sturdy rally leg of the last 11 trading days is going under minor summer trade-volume showing relatively many up gaps to the opening. Somehow the upleg is characterized by euphoria. Only 3 out of the last 11 trading days closed in a minus. Besides, in these cases the daily loss is marginal. Any geopolitical dawn of hope is being bought like crazy even though everybody can see that now ¼ of the world is burning and seething. Such a really safe haven isn’t the S&P 500 either. Gosh! The last one turns out the light…
The last exhaustion move in the S&P 500 is just being on = exhaustion upwards into 2000 is what I’d like to diagnose… a last little snaps for the drunk before the disco lamps go out I suppose:
Would I bet/hedge 2.xx billion US$ on the stock market collapse as George Sorros did recently? Don’t think I would be able to raise that amount… not by far I would, that’s clear. From the logical standpoint you might thoroughly bet on a brutal market collapse however because the European and US stock indexes are simply diverging so much being insomuch different chart-technical states, the world burning, the bogey of deflation going about, the politicians and governments side-slipping totally. In the S&P 500 I wouldn’t yet upgrade my short-position. Not yet I would, but guts is what George Sorros has got, by all means!
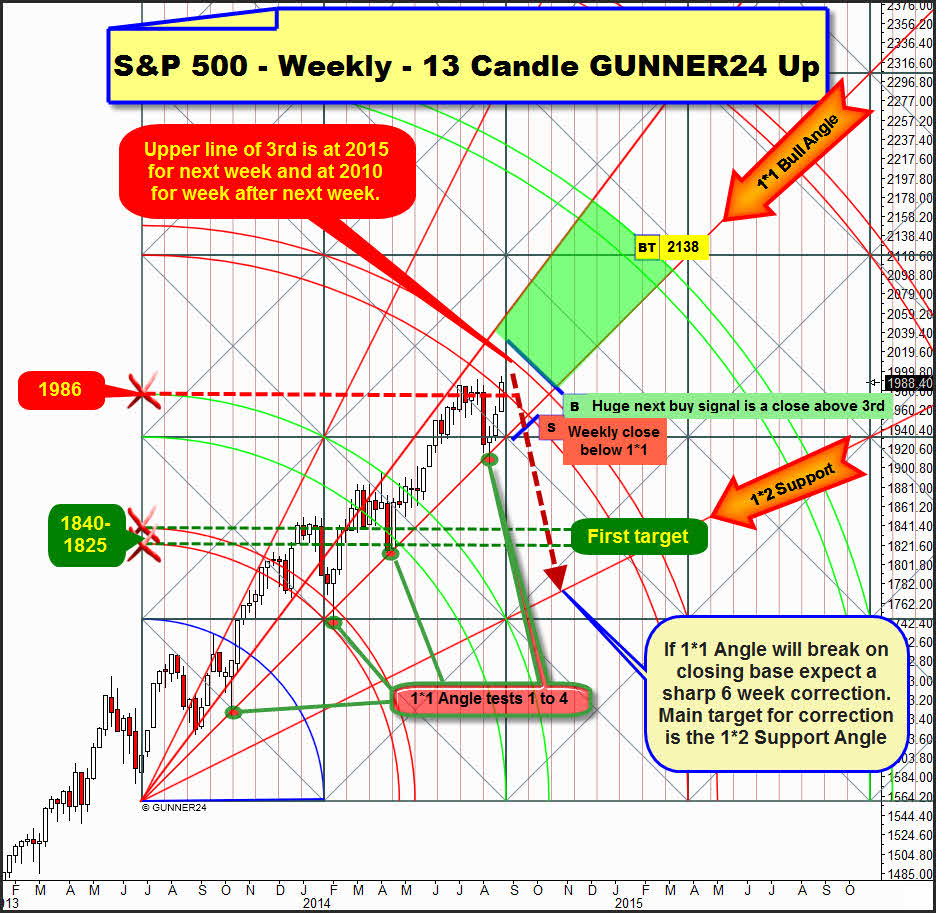
The trend is your friend, and in the case of the S&P 500 it is certain = uptrend! The S&P 500 is going to remain in the confirmed uptrend until the first weekly close below the 1*1 Gann Angle occurs. In the chart above, I call it the 1*1 Bull Angle.
Mind about this the 4 previous tests of the 1*1 Bull Angle. The 4th test was successful as well. Starting from the 1*1 Angle, for 11 days the market has been popping up again. The 2000 will have to be worked off, within the next 10 trading days.
The 2000 and reaching the 3rd double arc in the weekly 12 candle up are a natural target of the market. My assessment in June was that this target would have to be worked off between 07/24 and 08/05. The fact that the market decided now, for the fourth time to rebound sustainably from the 1*1 Angle is permitting now 3 scenarios instead of just one as supposed in June, one out of the three not being beautiful at all.
Scenario 1: Everything is alright the party going on, the index is going up to the 4th double arc till spring 2015, without troubles. Target in this case would be the 2135 till about April 2015. This "inflation scenario" will be confirmed if the index succeeds in closing above the 3rd double arc on weekly closing base within the next 4 weeks. I.e. concretely, a weekly close above 2018 within the next 4 weeks would make the party go on. Probability of this scenario is a 5%.
Scenario 2: Probability a 60%. The market will work off the 2000 within the next 10 days. It will be allowed to reach the upper line of 3rd double arc resistance during the current exhaustion move between 2015 and 2010. The upper line of the 3rd for next week is at 2015, for the week after next at 2010. That is (2000 or 2015 or 2010) is where the market will top out starting its sharp correction during minimum 6 weeks, maximum 8 weeks and breaking at first the 1*1 Bull Angle in order to turn upwards again then at the first target = 1840-1825 horizontal support heading for the old peaks till the end of 2014. Official main target for the correction is – since a final break of the 1*1 Angle always activates also the next lower important Gann Angle as a target – the 1*2 Support Angle at about 1780.
Scenario 3: The-last-one-turns- out-the-light scenario. The George Sorros bet/hedge. Final market collapse down to 1500 till year end 2014. Probability 35%. This scenario just became feasible at all because the S&P 500 went still upwards even though at the latest from 08/06/2014 it would have had to correct. In this "deflation-scenario correction", the correction should come to rather 20-25% instead of the normally usual 10%.
These will be thrilling days to come… as well as for gold. The forecast is still allowing gold to work off the 1400 till the end of September/beginning of October:
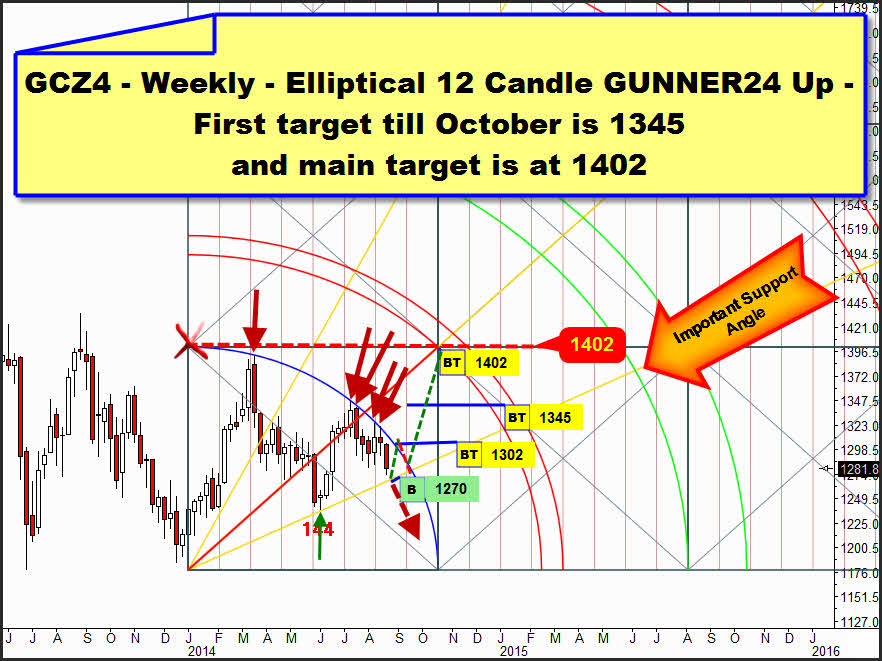
A good moment for buying should be the 1270 area next week. That’s where the true trend-line of the 2014 uptrend is taking its course. "Uptrend" is well-intentioned here, but technically it’s the absolutely correct term. 2014 is rather going to be a sideways year. Merely technically, for 2014 a crystal clear uptrend is present so far because the current weekly uptrend started at the last trading day of the year 2013 being marked the current 2014 low at the first trading day of the year 2014 and in addition being produced in the altogether 144th week (high and important Fibonacci number) of the whole correction since the 2011 highs, a higher weekly low (green arrow).
The fact that the weekly highs have featured lower weekly highs so far in 2014, does not matter here. An uptrend is present when confirmed higher lows are shaped.
The lower weekly highs in 2014 can be captured perfectly with the elliptical Blue Arc = 2014 resistance. The Blue Arc shows us the elliptical course of all the important lower weekly highs in 2014 – red arrows. These 5 lower weekly highs marked with red arrows are in an exact mathematic context with both important higher weekly lows – green arrow and starting point of the setup.
Next week will be in stroke distance to the Important Support Angle that connects both important higher weekly lows. Thus, for next week the very strongest gold support for the year 2014 will be at 1270. It’s an extremely promising entry-mark into longs since we should always trade in trend direction, true to the motto "the trend is your friend". Furthermore, in September begins the strongest phase of the year for the precious metals. A minimum of a 4 week rally is technically to be expected. No matter how strong the coming 4 weeks will result in the end and no matter which structure the next upleg will form during these 4 weeks… beginning at the Important Supprt Angle, the market is supposed to head for the Blue Arc Resistance =1302 again.
A final break of the Blue Arc resistance is – just because of the now expected strong seasonality – to be factored in with more than an 80% of probability. If the Blue Arc Resistance is clearly taken upwards on weekly closing base, i.e. a weekly close of 1305, gold will pretty probably be able to work off the 1345 first target until the end of September/beginning of October.
Officially, with the final break of the Blue Arc on weekly closing base the first double arc resistance will be activated as the next higher weekly uptarget after all = 1402 = Ukraine-invasion scenario. Let’s wait and see which way the geopolitical environment will develop.
If the Russians really roll into Eastern Ukraine, it’s likely to happen by the end of October/beginning of November. It will be cold then. The Ukrainian Army is supposed to be bled to death then. The Ukraine population would be pretty helpless in that case because they will not have been able to heat with gas during weeks. Putin’s tanks will go quickly where they want to. In 7-10 days, the entire invasion might be settled without much resistance nor bloodshed. See the Georgia campaign.
If the trend for 2014 breaks because the Important Support Angle on weekly base is fallen below, i.e. a weekly close below 1260 during the next 2 trading weeks, the 1200 respectively the 1080 might be reached very rapidly = deflation scenario.
|
„As far as I know", the GUNNER24 Forecasting Method is the globally unique and only technical analysis tool that deals intensely with the comportment of the market at support and resistance marks being able to combine that with price predictions. You’ll learn everything on these really "secret" facts in the Complete GUNNER24 Forecasting and Trading Course. Order now!
Be prepared!
Eduard Altmann


