The intentions of the NASDAQ-100 is like a book lying open in front of us. One piece of the puzzle after another have been complying into each other after the Brexit low having been reached. The next important price-and-time target has developed.
Let’s start reading at the low of the year 2014, then you join me to the status quo and afterwards we’ll browse a couple of pages into the future:
For 2 years, the extreme importance of the final low of the year 2014 in the US stock market flourished in obscurity to me. Not before the recent summer break – you can’t release completely, after all – I became aware how relevant these lows might be for future market prognoses resp. it became clearer to me.
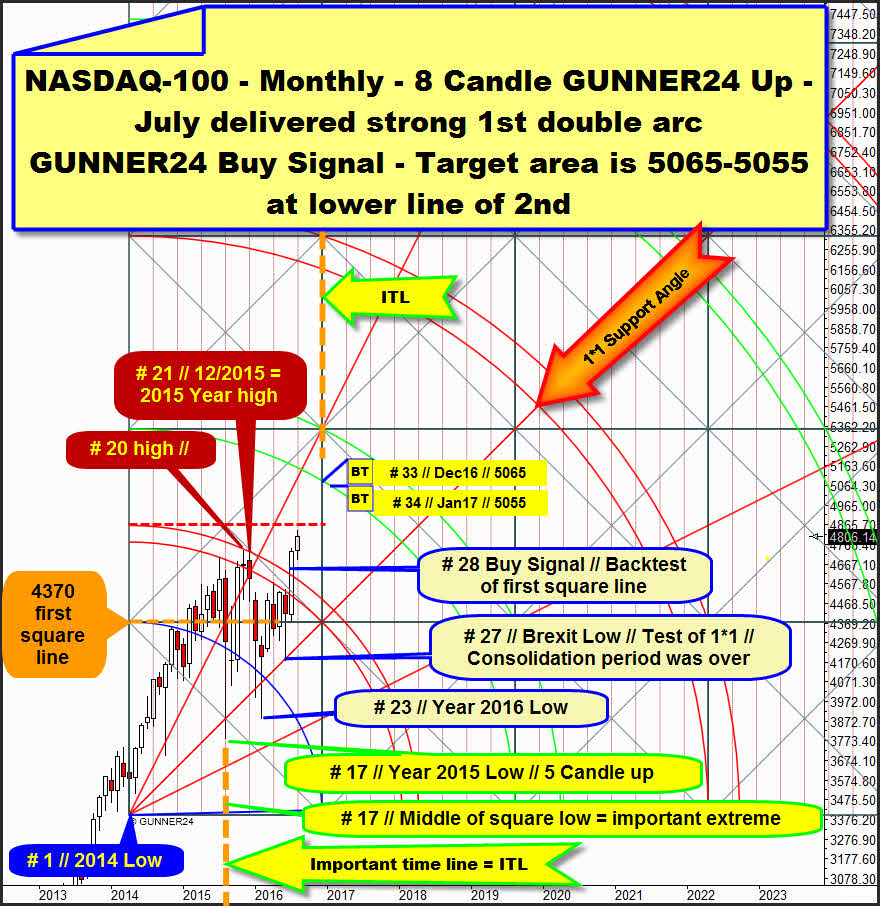
In the monthly chart of the NASDAQ-100 above, you see the valid GUNNER24 Up Setup that came up after the final low of the year 2014 (# 1). This upmove during the very first 8 candles that emerged after the final low of the year 2014 had been reached determined predominantly the course of the past couple of years. Owing to the signals triggered by this setup, now it’s possible to make important and stable predictions concerning the further future course of the index!
Time signals:
The 8 candle up chart above inter alia always generates prognoses on where important turns/extrema might be pending resp. allowed to be expected. Exactly in the center of the first square, the index achieved an extremely significant monthly extreme at the thick horizontal dotted orange vertical. That 17th month of the upcycle marked the final low of the year 2015.
This truly extreme spike low thereby coincided with an important GUNNER24 Time Line = ITL. This change provoked by an ITL triggered a massive strong rally that reached the upper line of the 1st double arc resistance magnet for the first time at the high of the # 20.
Ultimately, the index topped finally at the Fibonacci number 21 by reaching the December 2015 high + by the second test of the upper line of the 1st resistance into the year high 2015.
We all remember quite well what broke loose immediately with the beginning of 2016. The world seemed to perish…==> It had to perish for sure because the 21st Fibonacci month (21 is a high Fib number, thereby always possible point of change according to time) entailed a significant top exactly at an important GUNNER24 Double Arc Resistance.
==> The world recovered itself at the February 2016 low in the 23rd month of the upcycle. The # 23-low is the final 2016 year low.
==> The next important point of change – likewise an important low for the index – was the Brexit low, reached at the low of the 27th month of the upcycle. The # 27-Brexit low tested back accurately the very most important bull market support being the 1*1 Support Angle. This last test of the 1*1 Support Angle at the # 27-Brexit low unleashed the next rally-leg the market is currently in.
==> Since the current rally succeeded in overcoming visibly and clearly the very most important resistance, the resistance of the 1st double arc on monthly closing base at the # 28-July 2016 close, the lower line of the 2nd double arc is now the next activated important uptarget for the NASDAQ-100 in the monthly time frame.
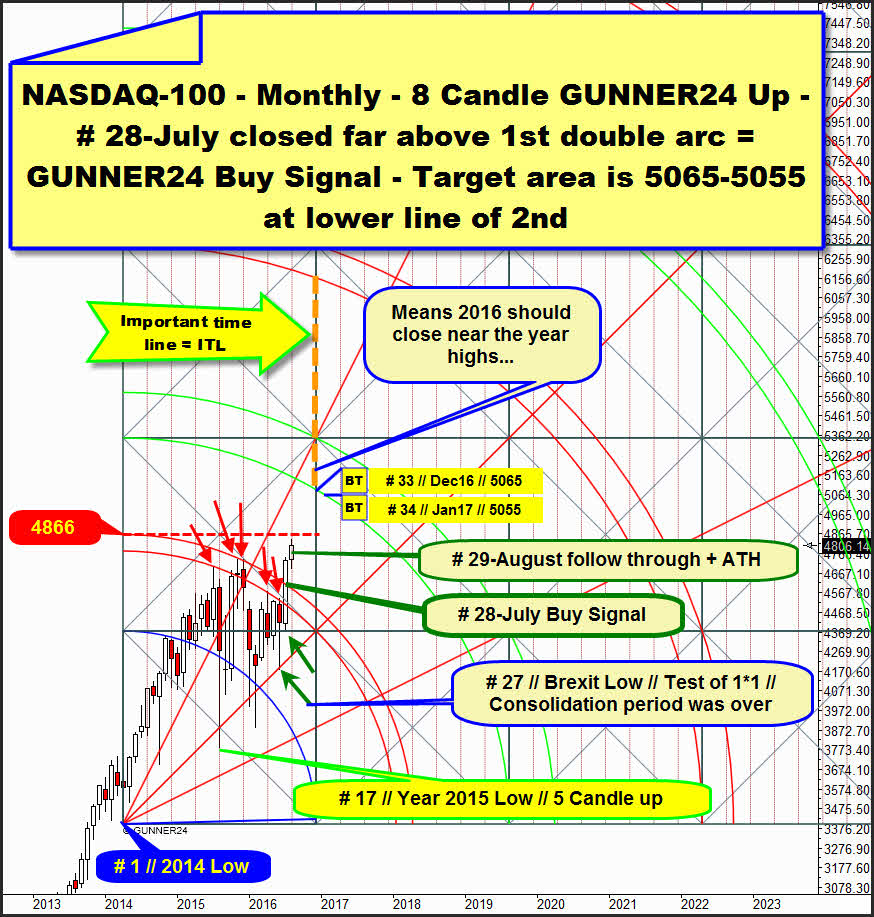
==> Since the past # 28-July, as well as the present month of August 2016 (# 29) were able to attain a higher high than the 21st month of the upcycle and in addition in August 2016 (# 29) could reach a new alltime-high (ATH), the index should have to keep on booming strongly now till the next higher Fib number above the 21 will be allowed to facilitate the next important change resp. the next important top.
==> Thus, the NASDAQ-100 should have to reach the lower line of the 2nd double arc upmagnet till January 2017 then being the 34th upcycle month!
With more than an 85% of probability + certainty, the index will work off the lower line of the 2nd double arc either at 5065 in December 2016 or – at the latest – at 5055 index points in January 2017. Even though December 2016 is just the 33rd month of the upcycle, it offers itself as the next important month of change because the next reachable ITL, hence the end of the first square, falls on December 2016!
Price targets and current signal situation:
Now, have a look again at the same setup as above, just with sharper focus on the price reaction of the market at the present GUNNER24 Magnets:
What we’ll have to internalize and always recall during the coming weeks is this:
The # 28-July GUNNER24 Buy Signal is mighty, yeah it’s epically strong!
All the red arrows mean exact contact either at the lower or at the upper line of the 1st double arc resistance. They also show how often the upper or the lower line of the 1st provided resistance in the monthly time frame. The 1st magnet has been the most important combined monthly + yearly resistance since mid-2015.
With # 28-July thereby a resistance in the combined monthly + yearly time frame was taken that had provided powerfully strong resistance for more than a year.
# 28-July closed far above the 1st double arc resistance. This singularly indicates power. It’s an expression of the present upforces!
# 29-August reached a new ATH – indication of power – indication ongoing power. It absolutely confirms the # 28-buy signal and the power of the # 28-buy signal.
I don’t think that # 29-August has topped already. The next higher important resistance in the monthly time frame won’t come into play before the 4866-GUNNER24 Horizontal. The 4866 is strong upmagnet for the current month of August!!!
Starting point of the current rally-leg is certainly the # 27-BREXIT LOW at the lower green arrow. So, this low triggered the current impressive rally thrust that came along strongly! That’s where a 7 month consolidation resp. correction period came to an end. (# 21-top – # 27-low!).
==> Thereby, quasi as a first brief conclusion: With # 29-August, the NASDAQ-100 is in the 4th month of a new multi-month upmove/rally that should easily last till year-end 2016, as to the Fib number! August is 4, September 5, October 6, November 7 and December month # 8 (Fib number!) of the current rally move.
Well, dear friends, let’s go on browsing. For all of us follows another important indication that the index will have to keep on going up till year-end 2016, without much ado. Let’s apply this 5 Candle up at the # 17-low, the year low 2015:
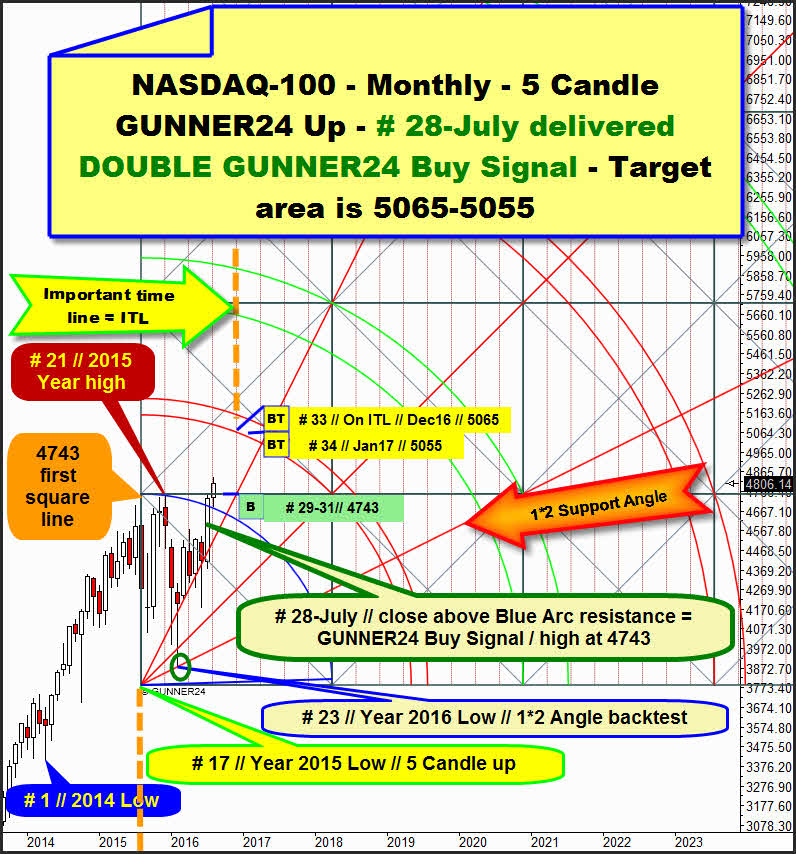
At the # 17-low, a textbook 5 Fib number initial up impulse developed topping out at the # 21-year 2015 high.
The subsequent deep down wave tested the 1*2 Support Angle PINPOINT at the # 23-low. The # 23-low was a spike low. This means the releasing of powerful upforces at the low…
Therewith this successful 1*2 Support Angle test is responsible for the year 2016 to become certainly a flawless uptrend year. Uptrend year always means that the year will show a good plus the year low being marked at the beginning and the year high by the end of the year.
We remember well what we learned above…: # 28- July clearly broke through important combined monthly + yearly GUNNER24 Double Arc Resistance. In the 5 candle up, the powerfully strong # 28-July development likewise means a first important GUNNER24 Buy Signal because the important Blue Arc resistance on monthly closing base was overcome.
==> Thus, the # 28-July close triggered a double GUNNER24 Buy Signal in the monthly time frame + this close was able to overcome resistances in the yearly time frame!
The qualification of this setup for signaling and thereby for targeting is proven because the # 28-high tested the 4743-first square line resistance from below. Further proof: The current # 29-August tested back accurately the resistance of the Blue Arc previously taken upwards, pinpoint at the low.
Now, the # 29-August leaves the Blue Arc and the 4743-first-square-line-magnet environment heading for the activated uptarget of the lower line of the 1st double arc.
Well, the center of the first square according time and thus the next important time line and thus the next possible turning date will come into play in the 33rd month of the upcycle that had begun at the 2014 low.
==> In the quivers, we have two important up setups now, signaling that the NASDAQ-100 should have to go up to the 5065 resp. 5055 in order to deliver there a next important top at or near the Fib number 34 in December 2016 resp. January 2017.
==> And of course, a backtest of the 4743-first square line ensuing in the months of August till October 2016 would be an earlier X-mas gift for us!!!!
…and – because the fans love it…
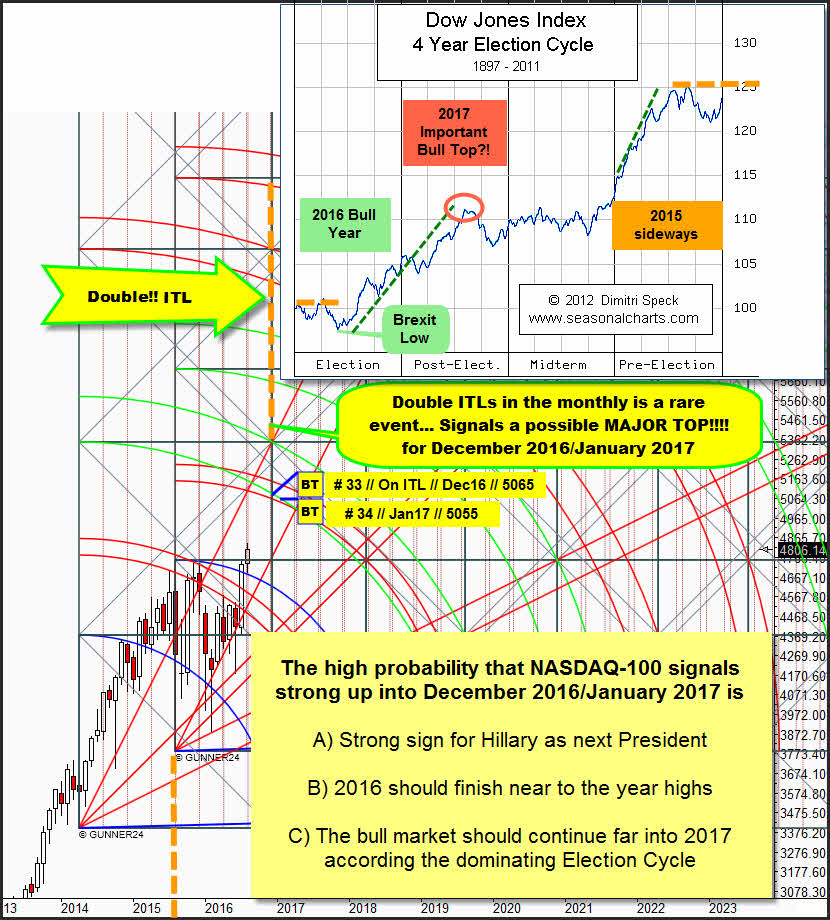
… to finalize of the issue I put both setups one above the other again. I’d like to clinch and clarify the important things resp. furthermore to tie the current rally move to the 4 Year Election Cycle.
Particularly important to me is the conspicuousness that both setups generate synchronously a double ITL for December 2016.
When two different setups – to boot in the significant high monthly time frame – signal an important change resp. exhaustion simultaneously and synchronously, it may happen there (price, 5065-5055) and then (time, December 2016-January 2017) of course. So it’s possible that there (price 5065-5055) and then (time, December 2016-January 2017 the bull market that had lasted since 2008 comes to an end, followed by a bear market that lasts 8-16 months.
==> Double ITLs are very, very rare. Thus, the present constellation is a dangerous combination for all the bulls!
On the other hand, the NASDAQ-100 has been following the 4 Year Election Cycle in a downright exemplary manner. I think it cannot really be flashier. From about the middle of the pre-election year, a consolidation/correction starts lasting more or less a year and being finished with the 2016 Brexit low.
With the mid-2016 Brexit low another strong rally move begins that should technically last at least till year end. GUNNER24 as well as the Election Cycle signal an uptrend year for 2016 being reached the year high by the end of the year.
If it’s up to the Election Cycle, the current rally move might turn out epically strong. I might/is supposed to extend to the third quarter of 2017. Wow! But that might match somehow. Anyway, the NASDAQ-100 made its ATH a short while ago. Overcoming finally such an old and therefore such an important ATH (the former ATH was made at 4816 pts in 03/2000) may unleash enormous bull forces according to price and time!
==>
From that, we deduce for the time being:
A) It’s not allowed but it would even be dull to short the US stock markets now! The crash prophets that use to come out of the woodwork in September/October are likely to be off beam completely, this time as well.
B) Those who hope for a significant turn before or shortly after the US Presidential Election will probably be disappointed because the NASDAQ-100 is signaling its year high for December 2016!
C) Hilary will be President. Wall Street keep on rubbing their hands. Never fight Goldman Sachs + the Fed.
D) The coming consolidations resp. corrections in the daily time frame till November should be bought!
E) In the weekly time frame, until the end of the current rally leg = till the expected next important top in the # 33-December 2016 and/or # 34-January 2017, technically we are supposed to experience only 1-3 week mini-consolidation cycles.
F) A backtest of the 4743 – provided it happens in the months of August till October – is currently the best cause safest entry into a new long-position.
Be prepared!
Eduard Altmann


