The German DAX topped on 06/20, due to the Ukraine worries. The US majors topped about a month after. The S&P 500 and the NASDAQ-100 turned on 07/24, as the first of the broader US markets the Dow Jones topping at 17151.56 on 07/17, the day of the downing of MH017.
With the Thursday sell-off, all the 3 US majors are in a confirmed downtrends now. I don’t think that the Argentine default was the trigger for the Thursday sell-off. In my opinion, Putin’s previous announcement of the inevitable energy price rise and Russia’s first counter-reactions to the US/EU sanctions was the cause. For at first the European stock markets crumbled, the US markets just joining.
After such a persistent and strong bull-leg a 2-3 month 10-15% price correction is rather the rule than the exception. For the Dow Jones, that means technically a correction potential up to 15440-14580. So, the earliest moment for the correction low is in August, at the latest in October, maybe November.
If the current correction in price and time turns out approximately as the last important Dow Jones correction move did – 6 week correction from the beginning till mid-February of 2014 – it is supposed to be going down by about a 5% from the all-time high, i.e. until the beginning of September down to about 16250-16200.
Both variants posed above are correction targets based on the wave and Fibonacci technique. Below, I’ll go into the Gann respectively GUNNER24 Targets:
These days I received an e-mail by a trader who asked me whether I lost sight of the S&P 500 respectively don’t have a handle on it any longer, because in the free area I haven’t gone into this index at all during the last couple of months.
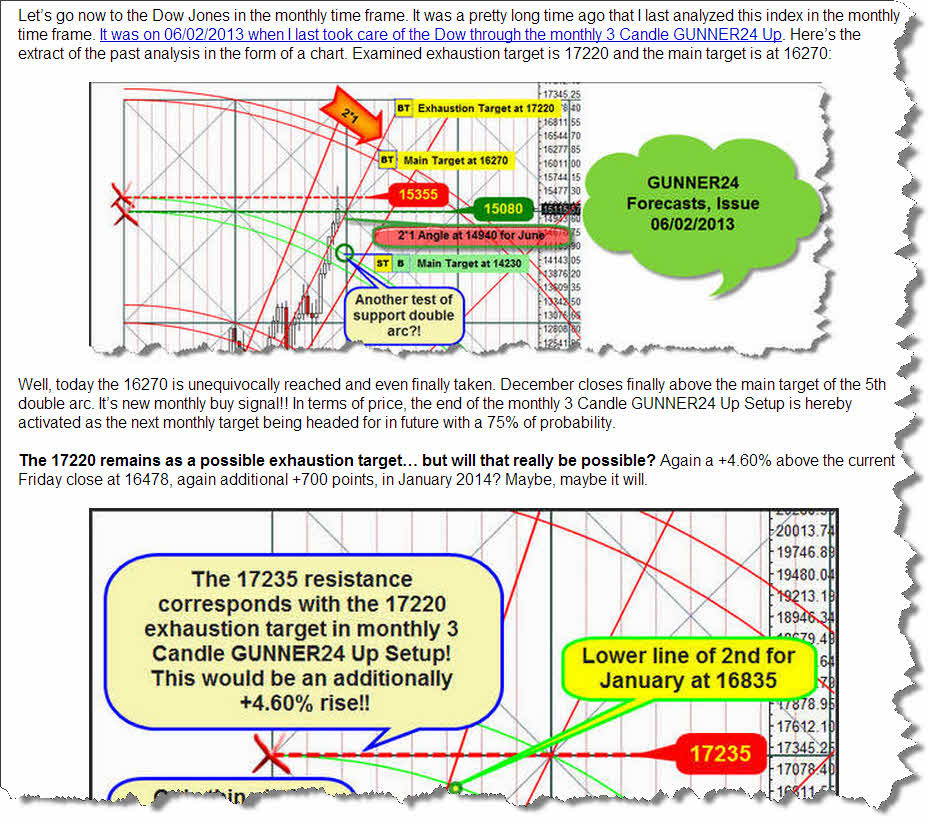
Yes, it’s true, at least temporarily it is. GUNNER24 Method couldn’t nail the high either in the S&P 500 or in the NASDAQ-100, either according price, or according time. As to the Dow Jones, as many as 7 months I haven’t deferred to it. The last time I did was on 12/29/2013. See charts and comments above.
I was simply fed up with watching this chewy rise of the last months purely analyzing again and again and all in vain. There were simply scarce short-setups/scenarios building up themselves.
After the Gann Decade Schedule, the year 2014 is a consolidation year, a sideways year, that only allows to buy stocks for long term only after a sharp correction takes place. 2014 is likely to close roughly where it opened, maybe a little higher…
I think it takes volatility for making money in a market. When markets are just schlepping along in a boring way you earn zippo. So I rather concentrate my efforts to make money elsewhere, respectively I’ve got more time of leisure because I don’t have even to analyze those incredibly mixed sluggish signals of Dow Jones/S&P 500/NASDAQ-100 every weekend again.
The last months, the mentioned markets really just crawled upwards like crabs somehow fertilizing each other but frantically avoiding the necessary - cause sane - 10-15% correction to ensure the continuation of the bull market at a 100%.
The steady denial to correct has aggravated everything in the end. Effective Friday, the Dow Jones is beneath the 2013 close by 83 points. In the course of one week, all the mini-gains tediously foraged over 7 months were robbed. A lot of investors’ effort for… zippo.
Further down, you’ll see some downtargets that make you sick. I’m really taking fright. Very deliberately I call them "war targets". Be it because on the one hand the already plainly raging financial war West vs. East keeps on goading each other. Nobody is able to foresee the different moves any more assessing the consequences. I’m afraid however that the Russian "partisan tactics" will harm the western financial markets more than vice versa.
The Russians respectively Putin are champions of these partisan tactics. They are in the real war as well as in the financial sector. I.e. not to say or announce anything before, slyly swinging large clubs simultaneously. Since WW II, wars have been won with partisan tactics, not with big area-covering campaigns.
Do the Obamas and Merkels of this world really believe that Putin doesn’t – somehow, with the BRICS-states, from behind - get at the money he needs for funding his plans? The mere menace of raising the energy supplies price is enough for Europe to force the financial area of the continent including the Euro into its knees severely. What do you think will happen with Europe if he discontinues the deliveries all of a sudden? What if any Ukrainian or Russian major, mercenary, separatist plays about with tactic nuclear weapons or something like that at Europe’s frontiers. It would mean complete chaos! Here in pan-Europe we wouldn’t even have electricity, internet etc. in such a case.
==> On the battlefield nobody has anything under control any longer. It’s a fact. Everything may happen. It’s a fact.
Hence, either the sops in east and west settle the Ukraine strife till October/November or – I suspect something bad to happen…
The Dow Jones exhaustion target was the 17220. It was first propagated on 06/02/2013, based on the forecast of this 3 Candle GUNNER24 Up on monthly base:
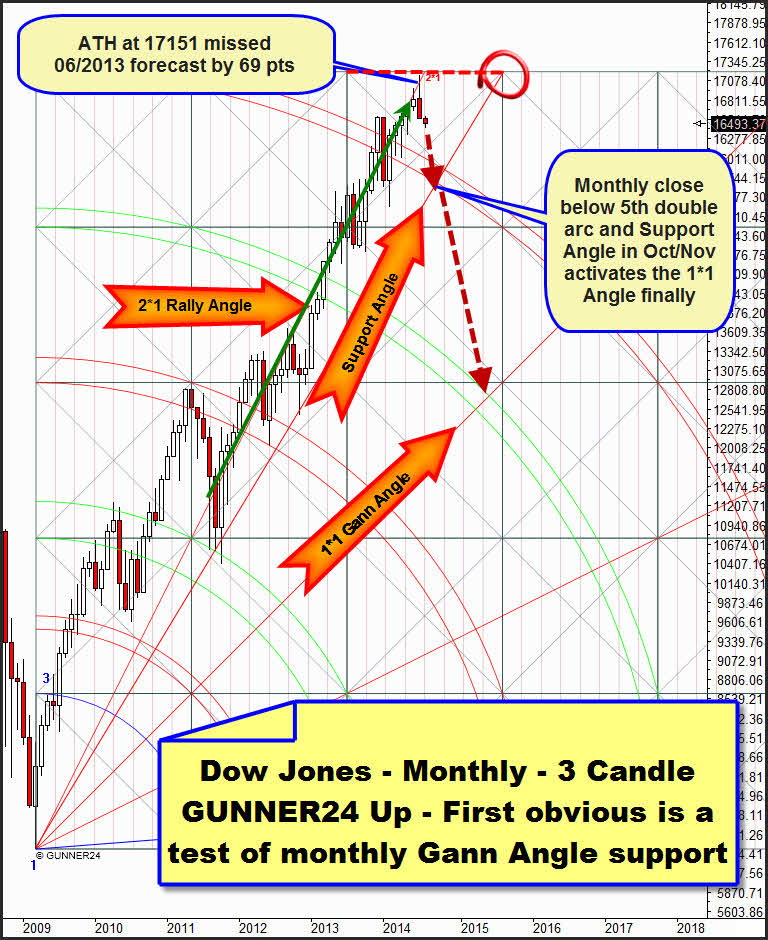
The rally has been orienting itself by the 2*1 Rally Angle since 2011, thus with the 17151.56 ATH having reached almost the maximally allowed extension of the first initial impulse in terms of price. Here, in the Dow Jones setup, we measure the first 3 month-impulse – as it should be – from the absolute low to the absolute high of the 3rd candle. Applying the Blue Arc by just the fraction of a millimeter lower = measure out the initial impulse however, we get the following picture:
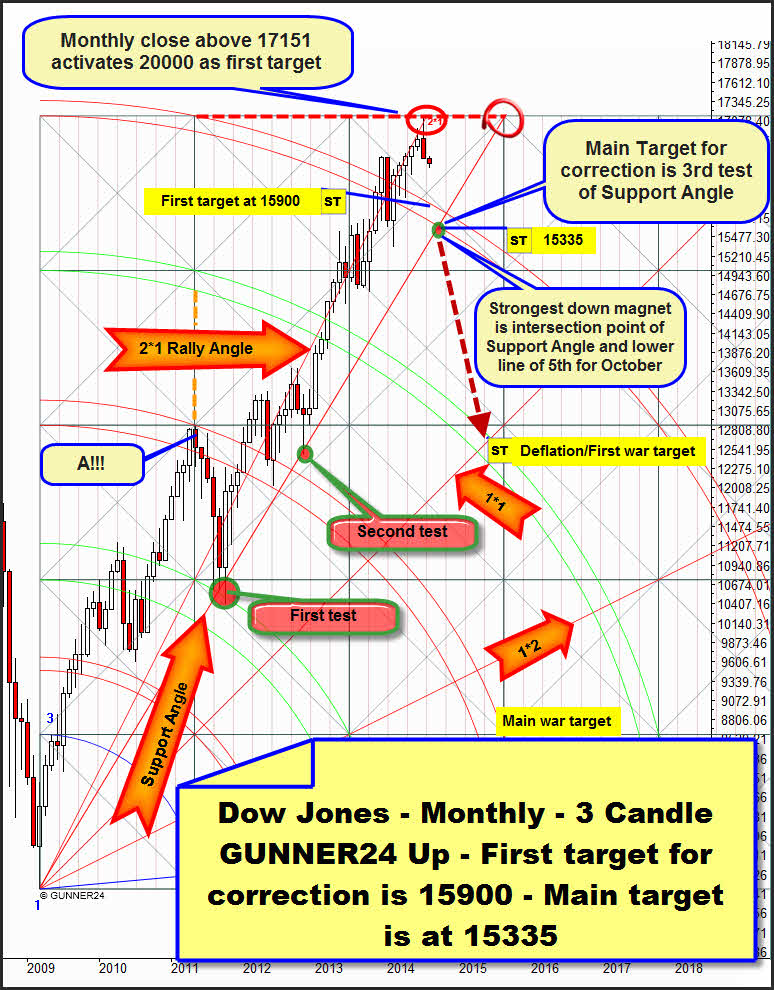
There’s really no great difference. Just the all-time high is lying exactly on the end (according price) of the setup. And, at A!!! there is an important monthly high situated exactly at an important triple Gann Magnet. This interim A!!!-high is exactly on the intersection point of the upper line of the 3rd double arc, a GUNNER24 Horizontal and an important time line.
Thereby the high at A!!! is an exact mathematic relation with the July 2014 all-time high. That means, this setup is relevant, valid, and above all it forecast the all-time high correctly and precisely. So we can use the magnets situated in the future as possible turning points, supports, resistances, targets etc. since they are in a mathematic – i.e. natural – relation with the past after all.
Well, what is to be concluded from the fact that the Dow Jones turned exactly at the price end of the setup starting its correction there?
A) Primarily to the big picture: A monthly close above 17151.56 will activate at first 20.000. The likely end of this bull is supposed then to be at 40000 until 2019. This is a permitted conclusion because the setup is nowhere near expired in terms of time. This setup won’t expire on the time axis before 2020, as long the current bull is allowed to go on running.
This is my absolutely preferred scenario! Technically the US markets are expected to go on rising – till 2019! In case of a monthly close above 17151 the first trigger is thereby to go into stocks again!
40000?! Yes! Just think of the current Argentine default. When a country goes broke simply the inflation is determining. The money goes into stocks that rise like hell. Just go ahead and google the Argentine default stock-rally. You’ll see a right-royal flagstaff. But don’t think that the common ruck of the small investors/traders would profit by the USA going broke. Many people won’t have electricity nor a bank account for trading, nor internet. They’ll just have telephone, maybe the fixed-line network will still be intact. A cut of investments and currency will be likely. Just google the current circumstances in Argentine…
B) The possible medium-term consequences: Since the price has reached th maximum extension of the setup in terms of price, the trend may change. Just theoretically a new bear market may start. The reversal candle in July confirms the possibility of the complete change in trend as well as the one of a deeper correction.
Since the price is at least correcting now, it is removing from the 2*1 Rally Angle. Thus, a la Gann body of rules, working off the 1*1 Gann Angle as the next lower important Gann Angle will be necessary. Any more questions? In case of high speed it will go down to 12500 through spring 2015. Whatever will have happened in the world, I leave it to your phantasy.
Rules are rules. One of the smartest minds when it comes to mathematics discovered this comportment of the markets. So we better take care hoping that the long-term bull support holds winning the inflation scenario and not taking place the global meltdown.
C) The short-term picture: The do-or-die area and at the same time most important down magnet for this correction is where the Support Angle and the lower line of the 5th double arc intersect at 15335 in October. At that extremely powerful Gann Magnet is where at the latest the correction is supposed to finish. If October or November 2014 close below this support magnet at the 3rd test of the Support Angle, the 1*1 Gann Angle and the 12500 will be activated as down target. A monthly close below 1*1 Bull Market support activates the main target of the war scenario outcome, a touch with the 3rd double arc support close to 8800 till fall 2015.
An important bull-market support and – most certainly – an important and probable correction target is the 15900. That would mean the chart-technically necessary and sound back test of the 5th double arc. If the 5th double arc on monthly closing base holds it will be confirmed monthly support and thereby the ideal springboard for the start of the new bull up-leg.
==> Conclusion. The correction is going well-ordered and within 6 weeks down to 15900 respectively the alternative is: The correction will be hefty lasting till about the end of October and reaching the 15330. Thus, at the moment the 15900 respectively 15330 are both lower trigger marks in order to go into stocks again large-scale. It’s obvious that in case of both possible low areas it will take confirmation signals on daily and weekly base to occur for justifying the re-entry into the stocks.
Likewise obvious is that for the time being the bias is going to be bearish the next days and weeks. So, day- and swing-traders will sell rallies until at least the 16200 environment = 50% Fibonacci Retracement of the rally of February 2014-July 2014 will have been worked off!
Let’s go briefly to gold:
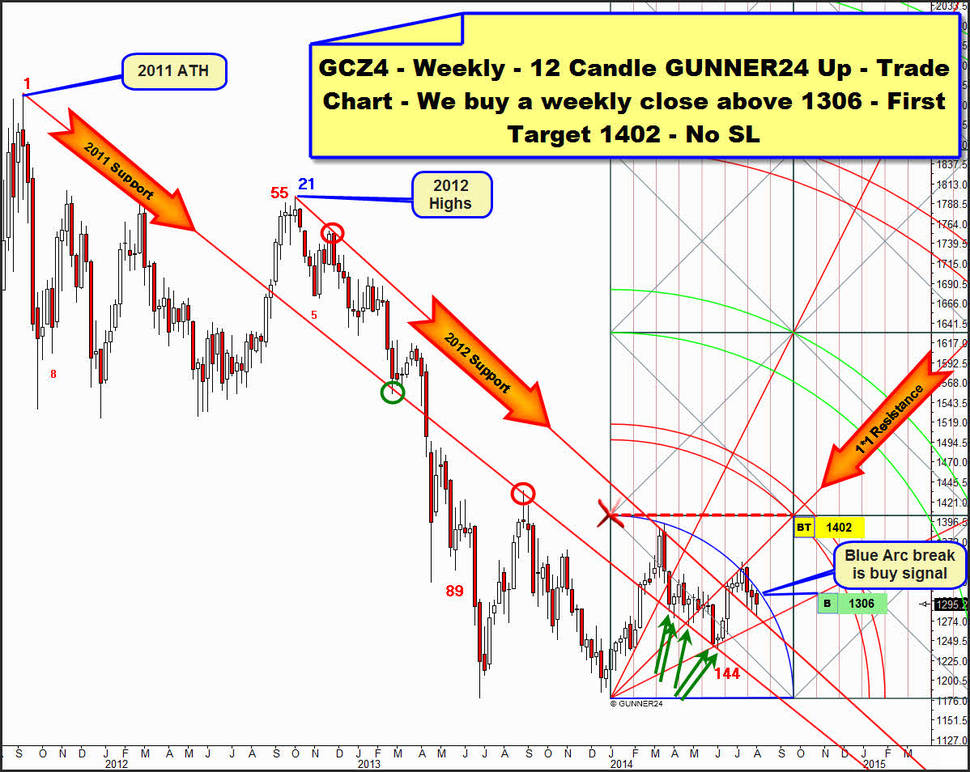
For the third consecutive week, gold has been subject to the resistance influence of the Blue Arc in the weekly 12 candle up. Likewise, the last week tested back the 2012 Support Angle at the weekly low. As remarked last Sunday already, currently gold is just testing back an important yearly angle. This one was dominant resistance over 2 years, being clearly taken/broken upwards however in the last upswing thereby presenting support function now.
In the end, actually gold is not doing anything else than in spring 2014. At the green arrows, a former resistance angle (now 2011 Support Angle) springing from the 2011 all-time high was tested back most intensely. In spring, gold had to test the angle 5 times altogether at the weekly lows before the next upleg was allowed to get started. By this successful test, the angle mutated to an important weekly support for gold.
==> The rally up to the 1402 resistance will be triggered officially if gold accomplishes to close above the Blue Arc resistance = 1306 next week. In this case, we’ll buy the yellow metal into the weekly close for the 1402 first target and the 1430 main target.
You need support finding the best cause most riskless entry in current stock market decline?
Be a part of our exclusive sworn GUNNER24 Trader Community – now…
- with daily trades – quick, safe and profitable…
- in well-chosen precious metals, commodities, indexes, currencies and in the best stocks worldwide...
- in both rising and falling markets…
- with little use of capital…
- with constantly more than 70% profit – year by year…
Be prepared!
Eduard Altmann


