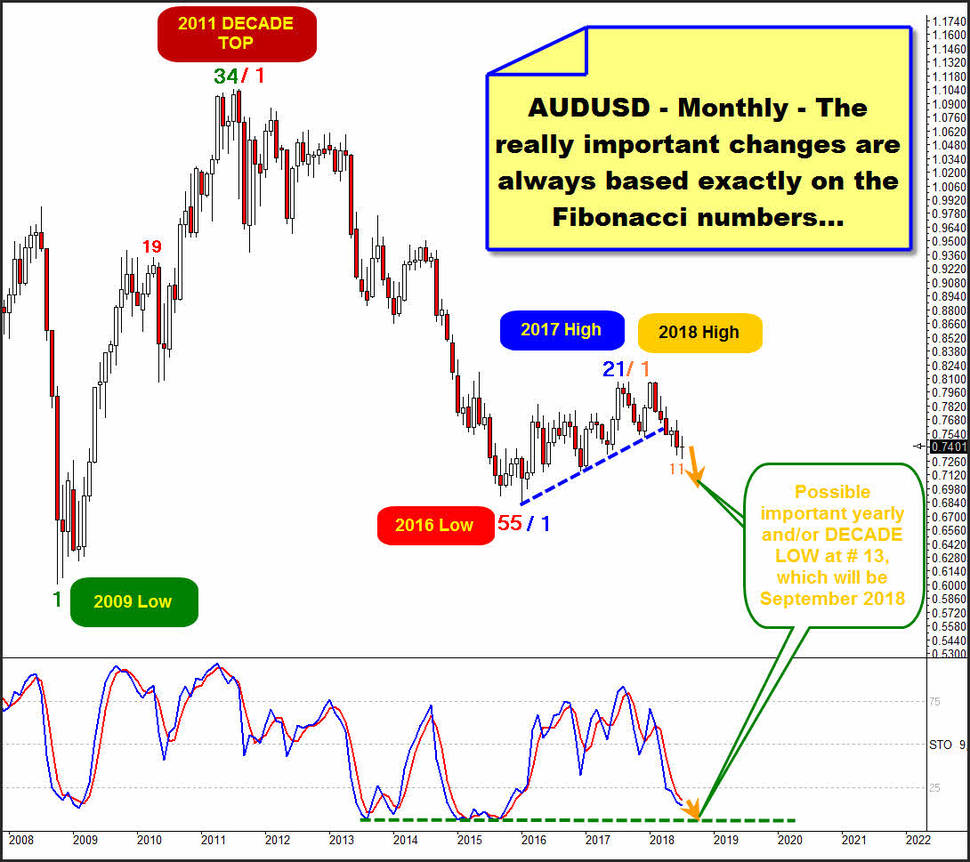
That's a very interesting series. The really important turns of this pair are always based exactly on the Fibonacci numbers.
The bull market from the final low of 2009 to the received DECADE HIGH of 2011 lasted for 34 month candles.
The persistence bear market which started at 2011 DECADE HIGH (red 1 below) bottomed precisely after 55 month candles into 2016 Low. Important higher low compared to 2009 Low...
The multi-year up run which began at 2016 Low (blue 1 above) topped after 21 months at final high of 2017 = blue 21 above.
Orange 1 marks the current resp. likely final high of 2018 and there 2018 downtrend leg began which is now at downtrend month # 11-July 2018. There is really nothing wrong with the view that the current AUDUSD downtrend cycle should continue at least for another 2 month candles, just to deliver a next important monthly or yearly low or trend change sometimes in course of orange # 13-September 2018. Longterm Slow Stokes readings support this opinion, my view. Than they could find a bottom at dark-green dashed highlighted long-term support...
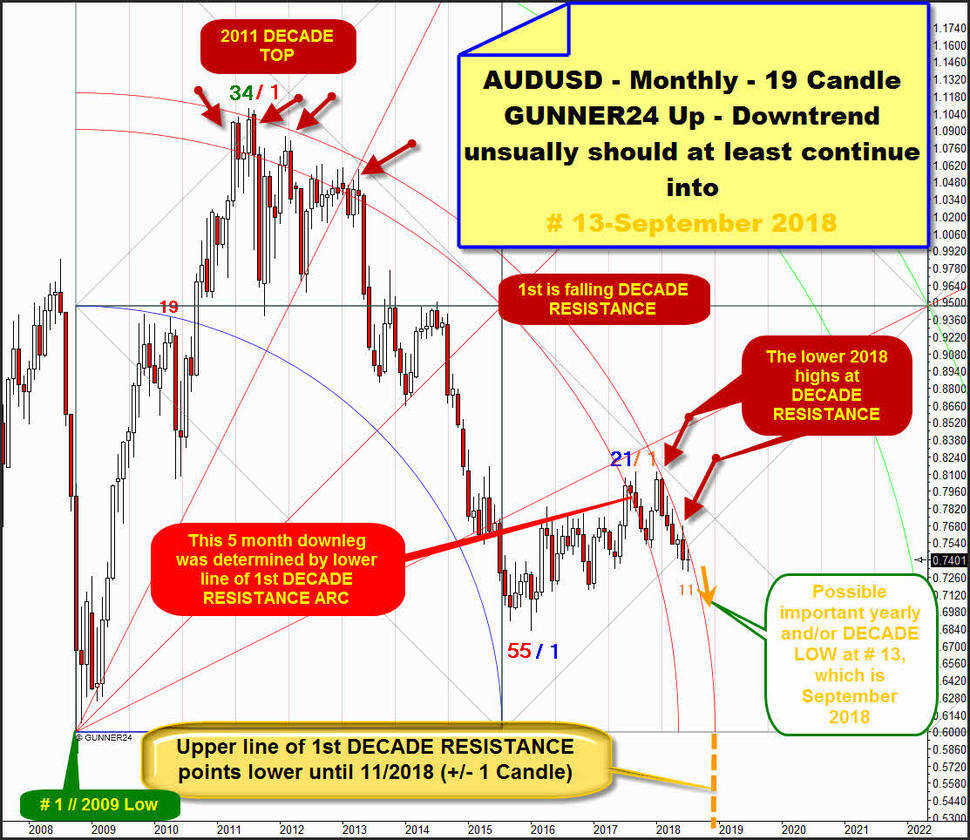
Next monthly view is for sure a "KILLER". Within we anchor a 19 Candle up at received final low of 2009:
Green 34 / red 1 year 2011 DECADE TOP is influenced by natural 1st double arc resistance upmagnet out of very important # 1 // 2009 Low. Space between lower line of 1st double arc and upper line of 1st double arc is DECADE RESISTANCE area! 1st double arc environment is a downward sloping DECADE RESISTANCE area. Where all in all, the final highs of 2012 and 2013 were marked as well.
Wonderfully accurate, the falling resistance of the lower line of 1st double arc kicked in at the final high of last year (blue 21). After that, the market had to correct for 3 months or so. Correction was oriented to the falling lower line of 1st resistance.
1st double arc DECADE RESISTANCE recently started to have a strong resistance impact at orange 1 = likely final 2018 High. And well, since orange 1-2018 High the overall declining upper line of 1st visibly puts strong bearish pressure on the market.
==> The 2018 downtrend leg orange 1 to orange 11 obviously is completely oriented to the downwards sloping upper line of 1st double arc! In addition, the recent two months highs of orange # 10-June 2018 and orange # 11-July 2018 (0.7484) came in quite exactly at DECADE RESISTANCE arc.
This means usually that # 12-August 2018 high should be next lower high compared to # 11-July 2018 high (0.7484) cause upper line of 1st DECADE RESISTANCE ARC acts as sharp defined falling month high threshold actually.
Mid-term outlook is as follows: ==> as far as the GUNNER24 Arc Rules are concerned, the pair might be subject to strong bearish pressure - DECADE TIME FRAME pressure - towards the end of the year, because the upper line of 1st does not cut the time axis until November 2018. With the prospect of achieving a potentially crucial important low on yearly base, yes, even next important DECADE LOW there! Always give -/+ 1 candle for such potential BIG extreme...
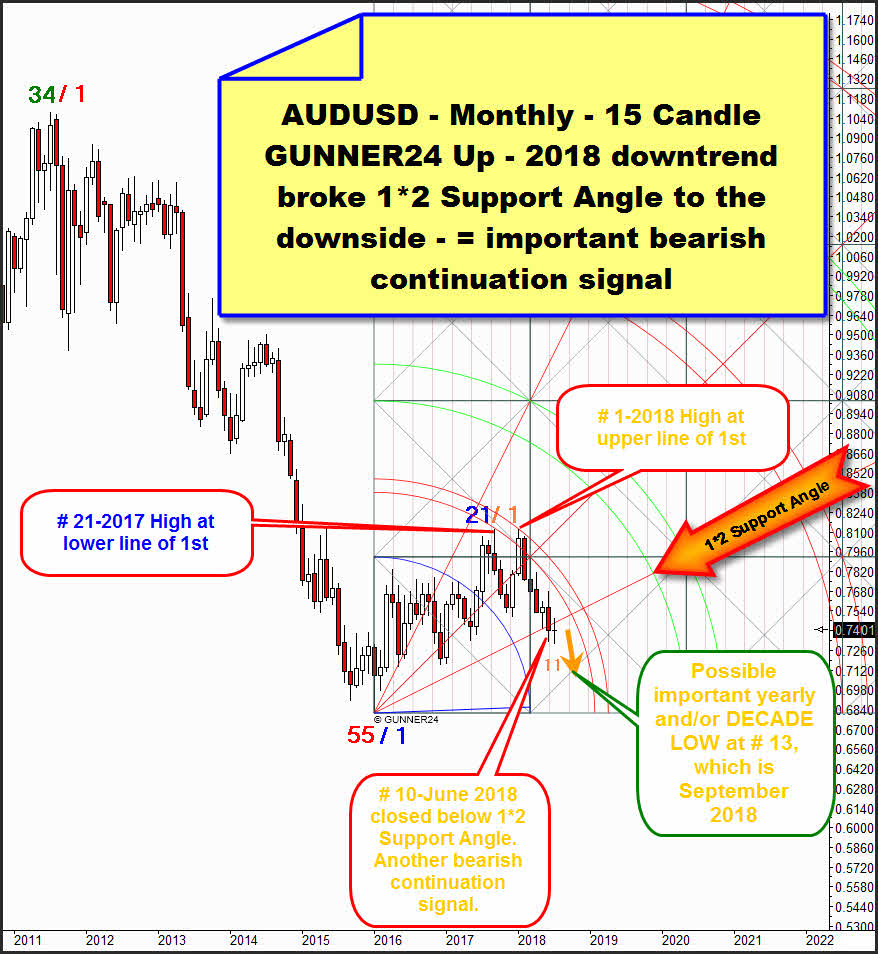
There is another valid up setup in the monthly scale, which start measuring upwards at red 55 / blue 1 January 2016 Bear Market Low. It helps us to assess the most recent developments more accurately:
Setup is an unusual 15 Candle up, but it depicts anything of importance we need for todays short attempt. Natural uptarget of lower line of 1st double arc out of important 2016 Low is 100% accurately worked off at final blue # 21-2017 High. Also, 2017 High has arrived at DECADE RESISTANCE. So there the time has met time, followed by a deeper and longer correction. Once 3-month correction has ended, the next monthly upswing finished at small higher high in the yearly at orange # 1-likely final high of 2018.
Orange # 10-June 2018 for the first time closed below important 1*2 Support Angle out of important 2016 Low, and current candle is treading water. This recent month close below 1*2 Angle, former bull market support, now usually strong monthly resistance, is another sell signal on monthly base. Impressive harbinger that downtrend should continue into orange # 13-September 2018.
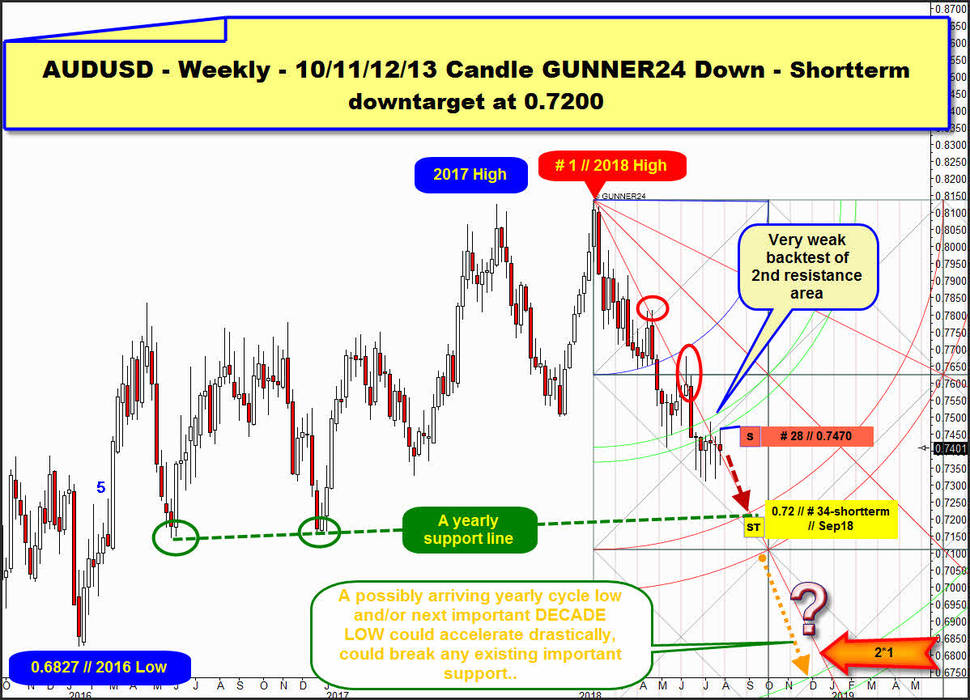
Last but not least let`s analyze weekly chart and valid weekly down setup. With the weekly charting work, we should be able to find a reasonable entry, as well as work out a logical downtarget for the downtrend which should/could bottom sometimes in course of downtrend month orange # 13-September 2018. As you can see right away, the potential 34th Fib number week of the downtrend is also in September:
G24 Down starts measuring downwards at red # 1 // 2018 High and is a very rare thing. Blue Arc depicts the lows of downtrend weeks # 10 to # 13 (Fib number) always to the T. A rare series nailing 4 consecutive weekly extremes with an arc, always gives a lot of initial confidence that the items of the setup or signaling of the setup will be mostly respected by the market.
Downtrend count is at week # 27 and downtrend is strong confirmed, making lower lows and lower highs. Downtrend is oriented to the downwards dragging 2*1 Angle which is main ruler of downtrend. In course of June 2018 the initial 1st double arc support was broken - finally broken! - to the downside. Simultaneously the 1*2 Angle support out of 2016 Low was broken to the downside, so pair delivered combined weekly and monthly sell signal.
==> Thus, in the weekly chart, the processing or a test of the upper line of 2nd double arc was activated, and experience shows that the processing of the target takes place with a probability of around 75%.
==> Since after the downtrend week Fib No 21 new lows were marked, the downtrend could continue until the next pending Fib number, which is the 34. The potential downtrend week # 34 falls in the September 10-14.
For potential downtrend week # 34 the upper line of 2nd activated downtarget at exactly 0.72 will be intersected by dark-green dotted multi-year support line.
Thus, we have identified a very attractive downmagnet in terms of time and price. 0.72/September 10-14 could be the most important goal of the downtrend!
==> Shortterm downtarget at 0.72/September 2018, 10 -14!
Think entry area for some shorts is obvious...
Since the final 1st double arc downwards break a few weeks ago, pair behaves very weak, showing no significant upforces, just able to test lower line of 1st double arc resistance from below. We could sell the possible next test of lower line of 1st double arc resistance which is at 0.7470-0.7475 for Monday starting downtrend week # 28!
Be a part of our exclusive sworn GUNNER24 Trader Community – now... I try to make you rich!
- with daily trades – quick, safe and profitable…
- in well-chosen precious metals, commodities, indexes, currencies and in the best trending stocks worldwide...
- in both rising and falling markets…
- with little use of capital…
Be prepared!
Eduard Altmann


