Until Friday noon, New York lunch-time, everything was on the rails for the gold bears. Even to me – certainly not a fundamental bear, just a chartist and forecaster – till then it was clear as daylight that gold was conclusively on path to turn downwards newly and finally, testing the June lows (1179) within the coming 3 trading weeks and perhaps falling below.
But on Friday noon something happened that shouldn’t have happened – a new shift in sentiment as it were… The market bought wildly the third test of the daily 1313 support managing afterwards to make close gold for the 5th consecutive time above the enormously important monthly horizontal support of 1322.
In addition the bulls succeeded in making close gold near the session highs thus being the weekly highs. This immensely strong upmove of the last 6 trading hours of the week is a powerful broad hint that gold is willing to keep on rising for 3 more weeks. The minimum uptarget in this case is 1387!
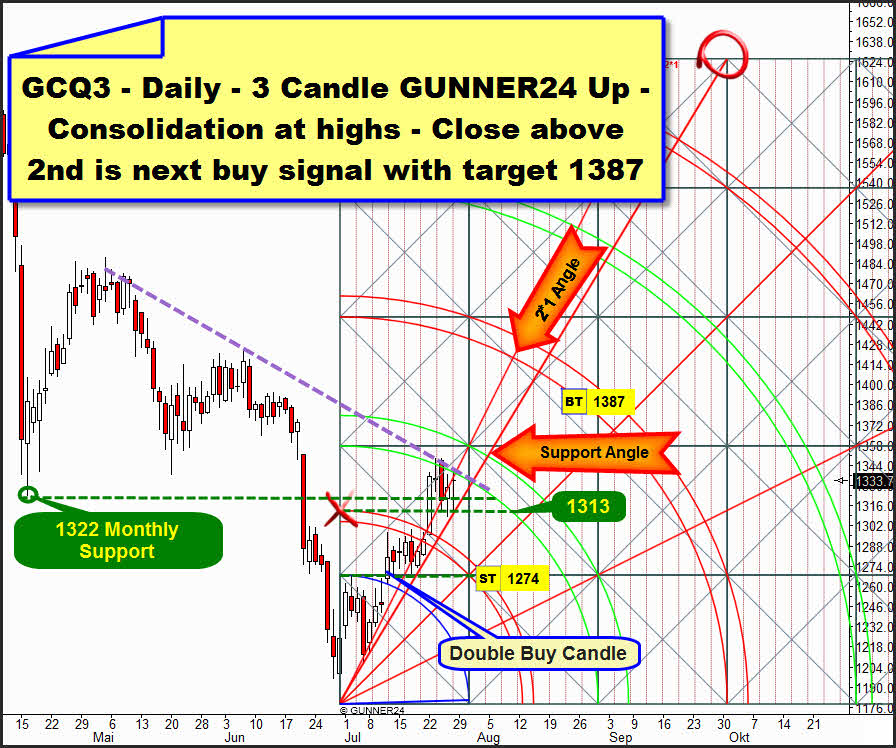
In the daily time frame gold is joining the 3 Candle GUNNER24 Up, starting from the absolute low of the current correction on 06/28. Gold has been following the natural resistances and supports of this setup in a classically perfect way. After the double buy candle of 07/11 that took in one go the resistance of the upper line of the first square and the resistance of the Blue Arc upwards, gold consolidated sideways beneath the first double arc. The resistance of the first double arc was taken last Monday, being confirmed afterwards the resistance of the 2nd double arc on Tuesday and Wednesday… During the last 4 days gold traded in a range. On the one hand above the 2nd double arc stops the price. Since Tuesday gold has been following the resistance of the lower line of the 2nd since it produces some lower highs on daily base. So far no daily close within the lines of the 2nd succeeded. Furthermore the daily trendline is stopping the rise (dotted purple).
The lower limit of the range is defined by the horizontal monthly 1320-1322 support on the one hand. Gold managed on Monday to re-conquer it, keeping it then on closing base 4 consecutive times. Then, at 1313 the horizontal support that starts from the intersection point of the upper line of the first with the beginning of the setup is backing the market on daily low base.
Departing from the third test of the 1313 on Friday noon the late rally started into close. That’s why we can analyze a daily triple bottom at 1313. It’s bullish! All in all gold is consolidating narrowly beneath the swing highs. That’s unambiguously positive because the consolidations beneath the highs use to be dissolved upwards.
The next daily buy signal will be generated after the 2nd double arc will be clearly broken upwards on closing base. Depending on the day, for next week this signal is between 1362 and 1356. In that case the 3rd double arc would be activated as a target at 1387.
This is valid as always: As soon as a daily close within the lines of a double arc is generated in an up setup we must consider such a closing as a harbinger for the corresponding double arc to be taken in the trend direction. So… if for instance Monday closes above the upper line of the 2nd – at about 1338 – consecutively the double arc would have to be taken. And I think gold’s got an odds-on chance to close one day of next week above 1338… The daily time frame is absolutely bullish… some more is coming up.
On the other hand – I can’t exclude such a performance for next week, it’s just become less likely somehow – a clear daily close below the horizontal 1322 monthly support next week (a close below 1315) means that a sell signal on daily and weekly base occurs. In that case the first downtarget on daily base will be the 1274$ sketched in the daily 3 Candle GUNNER24 Up Setup above. The 1274$ are daily as well as weekly and also a strong monthly support.
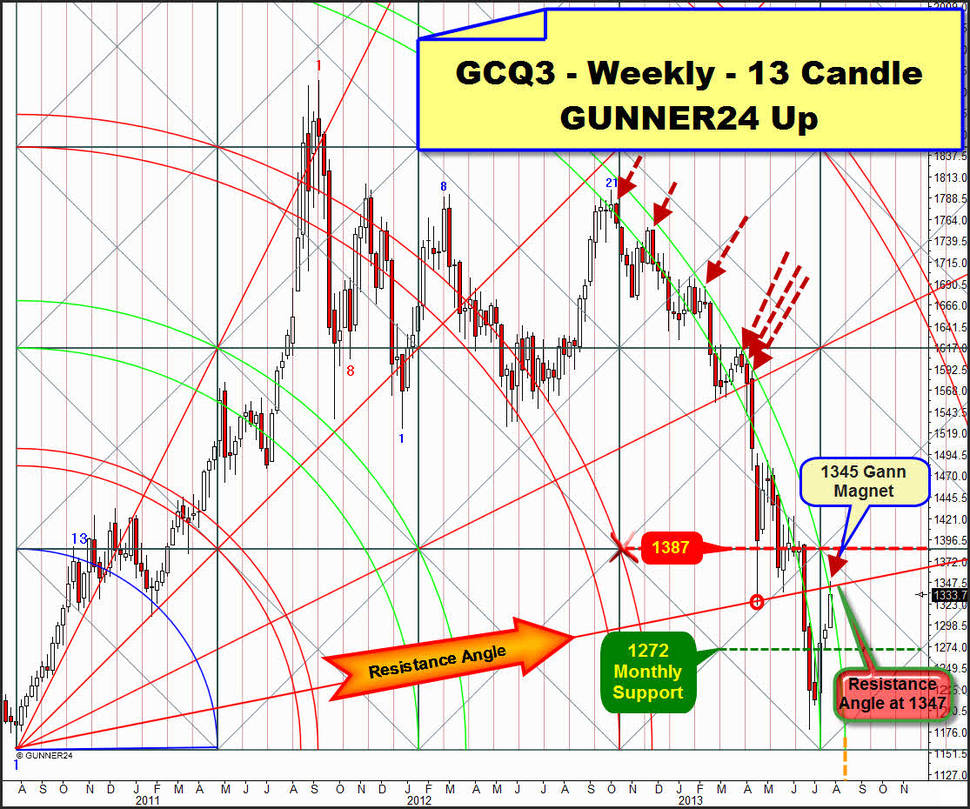
Why is it fidgeting in the bush now – in fact powerfully?! The resolution is given to us by the daily condition beside the well-known weekly 13 candle up setup. It is dominating, determining gold by the behavior at the 4th double arc since last October. That was last analyzed last Sunday. The weekly target of 1344-1347 notified in the issue of 07/14 was perfectly worked off by the 1348.70 highs of last Monday and Tuesday. Technically, after working-off this target gold should be supposed to fall reaching new correction lows. Technically…:
Here’s the actual level of the setup. The most important Gann Magnet is the 1345. At 1345 last week the Resistance Angle intersected the upper line of the 4th. When two important Gann elements merge in one price they form a so-called magnet. Magnets use to be strong attraction points for the price. That’s why gold will have to reach the 1345 working it off. Important for us traders and forecasters is always the reaction of the market after such a magnet is reached. From that we can derive the next signals or the future moves respectively.
In the actual case, technically the market was supposed to react strongly to the Gann Magnet. It should have shown a strong rejection. The Resistance Angle combined with the N-tuple proved resistance function of the upper line of the 4th should have triggered an enormously strong rejection from the 1345. But the reaction failed to appear…
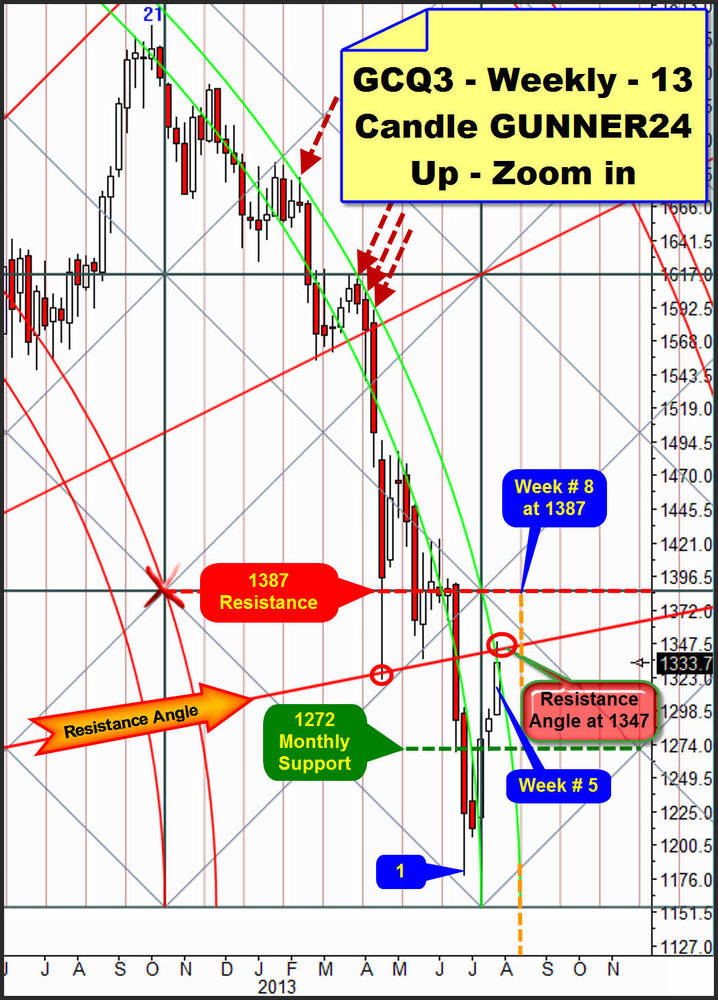
…because towards the weekend gold newly approached the resistance provided by the upper line of the 4th. It closed EXACTLY at the weekly resistance. During the last 6 trading hours it went up from the 1312 low to the 1333.70. It was free to choose. If it had closed at 1312 or lower, for all of us it would have been clear that it wants to join the resistance of the upper line of the 4th downwards next week as well. For all of us it would have been clear that the actual upswing in the fifth week would have shaped an important high being due a 3 week decline! At the middle of August the influence of the upper line of the 4th comes to an end – orange time line.
But now with the Monday opening it opens above the upper line of the 4th. So to speak the price skips the "temporal" resistance of the 4th. For the first time since October 2012 on Monday gold is going to trade above the upper line of the 4th. And that allows in the weekly time frame an 8 week upswing until the middle of August instead of a 5 week upswing, being the minimum target at 1387, the next higher weekly horizontal resistance.
We’ll get the confirmation for an 8 week upswing as soon as gold closes above the Resistance Angle on weekly base. This one is situated at 1347$ for next week.
On daily base next week we’ll get important confirmations for reaching the 1387 within the next 3 trading weeks as follows: A) The first "weak" signal but a harbinger will be a daily close within the lines of the 2nd double arc (daily setup/1338). B) New swing highs above 1349. The 1349 can already be bought pretty riskless! C) A daily close above 1362-1356 since in that case the 2nd double arc resistance in the daily time frame will be broken upwards finally and being confirmed.
In these whipsaw markets of the last weeks that might confuse any trader thus leading mercilessly to burning the trading account the professional signals have got their special importance. You get them in the GUNNER24 Gold Trader!
You best register with our GUNNER24 Gold Trader now. That’s where we oversee the optimal entries and exits for you. Especially in the difficult market situations where many factors have to be considered the Gold Trader is backed by the additional GUNNER24 Signals based on the combined 1, 4 and 8 hour setups to catch the optimum entries and exits.
The GUNNER24 Gold Trader will provide you with the critical knowledge you need to forecast and analyse the precious metals with the GUNNER24 Forecasting Method. All the GUNNER24 Trading Signals you receive real-time are based on the actual Gold and Silver Future. The NEW GUNNER24 Gold Trader is a must for every actively working investor and trader who wants to trade successfully in everyday trading. The insights you receive from the head trader Eduard Altmann (and discoverer of the GUNNER24 Forecasting Method) are truly amazing sometimes. I promise!
Click the button below and order the GUNNER24 Gold Trader - $39.90 US a month. For 201 members and up - $49.90 US a month.
A brief look at the planned trade in the S&P 500
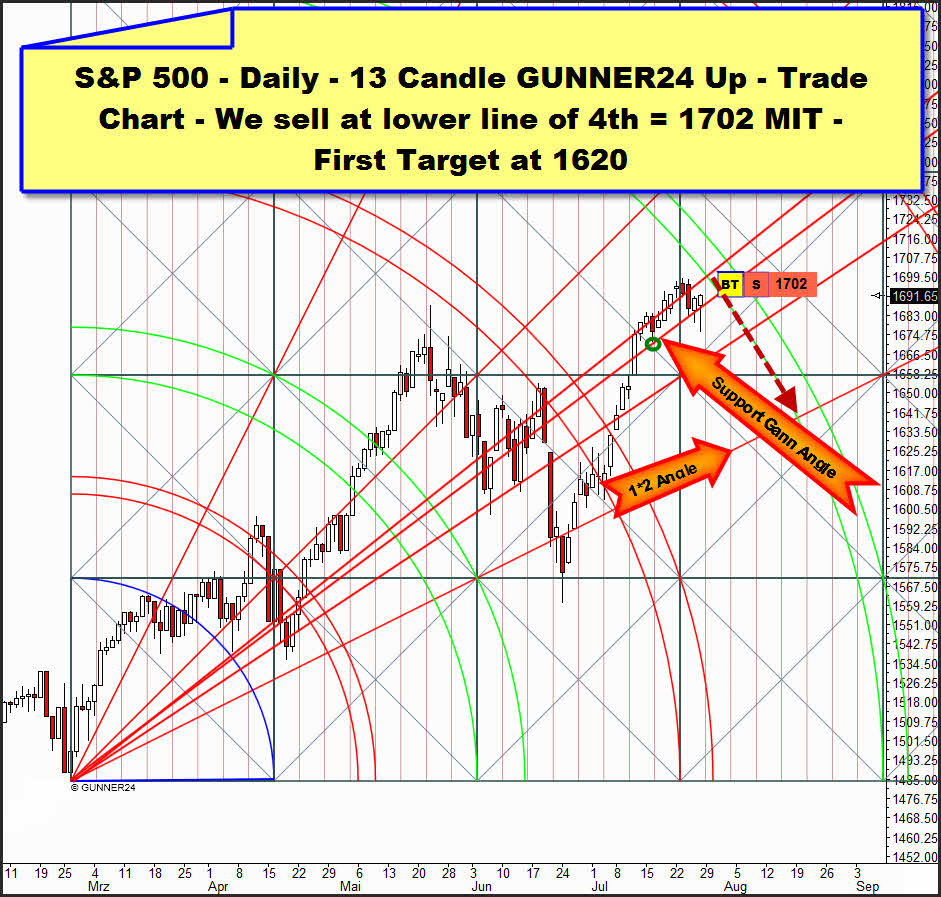
As thoroughly expected in the last issue the S&P 500 consolidated last week the all-time highs. Here’s the most important excerpt of last Sunday:
So point of change should be when the price reaches the resistance of the 4th double arc in the daily 13 Candle GUNNER24 Up Setup:
The price is likely to meet its resistance (lower line of the 4th double arc) as expected on July 30 or 31 respectively. We’ll go short there as analyzed extensively last Sunday – with a new sell-limit, valid during the entire coming week:Sell-Limit is at 1702 MIT (market if touched). Daily Position, no SL for the moment, first target 1620.
As usual, in the free area you may re-enact our trades here, always topically:
http://www.gunner24.com/trading-performance-us-stock-markets/
Eduard Altmann


