There are several bullish chart issues suggesting this: The WTI Crude Oil being in a prolonged downtrend since the beginning of the year formed an intermediate bottom by the June 2017 low attained at 42.05$. As it is not only the June 2017 low but moreover the final half-year low, it deserves a lot of attention – after all, automatically, reached bearish half-year extrema might always be matter of the final low of the year.
In a considerably uglier way than oil itself, the Oil Stocks were forced down this year:
USO, the most liquid oil ETP delivers a -18.00% YTD loss.
XOP, the Oil & Gas Exploration & Production Companies ETF shows a -22.31% YTD performance.
OIH, the Oil Services Companies ETF has a -23.06% YTD performance.
Yet also in the Oil Stocks segment, an extremely important bottom might have formed these days, and there is even some evidence suggesting that the Oil Stocks companies have left behind their respective bottoms of the year 2017.
==> That’s why in the following paragraph, you’ll find the possibly game-changing GUNNER24 Trade of the Day issue of last Friday 07-21-2017 going into the most recent occurrences in the XOP ETF illuminating intensely the prospects for a Major Bottom in the Oil Stocks.
========================================
GUNNER24 Trade of the Day 07/21/2017
The 1:3 Trade: Buy XOP ETF at 31.40
Dear GUNNER24 Traders,
The 1:3 Trade: Buy XOP ETF at 31.40
Our 1:3 trades are A) adjusted to a longer term, having a spacious stop-loss for the development not to be endangered and B) have to show a risk-reward ratio of more than 1:3.
Major Bottom play.
XOP is the SPDR S&P Oil & Gas Exploration & Production ETF and tracks an equal-weighted index of companies in the US oil & gas exploration & production space.
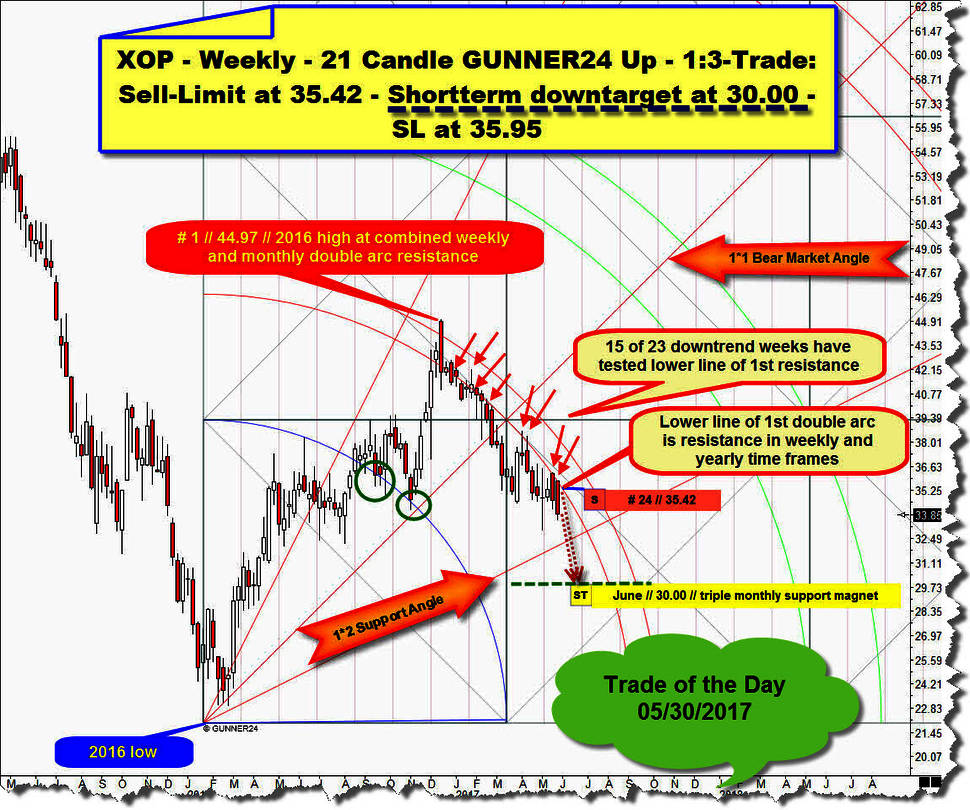
Today’s item is the follow up of the XOP forecast which was out in the Trade of the Day 05/30 issue. Please click here to re-read the last XOP outlook in full length.

Then we tried a XOP short at next test of the well-confirmed and downtrend-determining lower line of 1st double arc resistance, but entry price wasn`t triggered within recommended time.
The most dominating XOM setup is an up setup in the weekly and starts measuring at final 2016 low and the "textbook" Fib number 21 initial impulse out of 2016 low has forecasted natural resistance starting at 1st double arc environment. The 2016 high week even has dented the upper line of 1st but this was a bull trap. At # 1-2016 high XOP started its serious downtrend that is/was oriented to the downwards sloping weekly 1st double arc. Main downtrend driver was the lower line of 1st resistance upmagnet which forced market into 30$ support area.
As important downtrend target the 30$ area was identified with help of ruling monthly GUNNER24 Up Setup. 30$ is triple GUNNER24 Support Magnet in the monthly time frame. The first 30$ test arrived at low of downtrend week No. 27. The second test of 30$ triple support took place at downtrend week # 29-low:
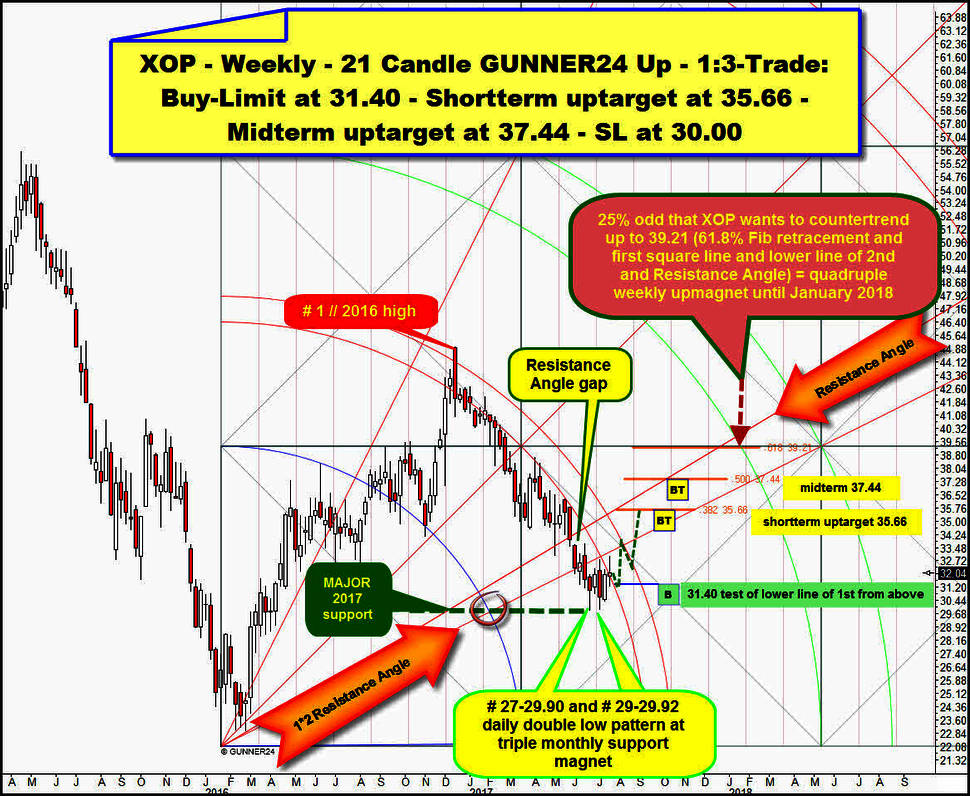
Above, you see the now updated weekly picture. As expected the downwards sloping lower line of the 1st remained the most important downtrend threshold into actual lows. The # 27-low is at 29.90$ and the # 29-low stands at 29.92$. Downtrend lows worked off 30$ support perfectly, and since downtrend lows a bounce can be recognized. So, we can write down that daily time frame shows a double low bottom pattern at monthly triple support magnet and that underway bounce in the weekly time frame was able to deliver a small higher low after # 27-current downtrend low.
Daily as weekly low structure signal unanimously a possible downtrend bottom.
Current 2017 low (# 27-low) arrived at a usual strong holding triple monthly support magnet.
The next interesting stuff that points to a final downtrend low made at # 27-bearish extreme is this week bounce behavior: ==> this week opened shy above the lower line of 1st and has very high odds to close above the lower line of 1st resistance threshold. Such week opening auction last was seen in course of February 2017. Last week close above lower line of 1st occured in course of January 2017....
Lower line of 1st resistance energy is strongly violated now! This points to the outcome that a stronger bounce is underway/has begun at # 27-downtrend low = possible final 2017 low.
==> I see a +50% chance that final XOP-downtrend low is in and a multi-month lasting countertrend has started.
==> If final downtrend low is in and final 2017 low was made, XOP at least should bounce upwards to 38.2% Fib retracement of 2016 high-2017 low cycle. 38.2% Fib retracement is at 35.66$, this natural resistance could be tested within a 13 week bounce cycle. If bounce has started at # 27-low bounce is now at week # 5.
==> Shortterm uptarget for todays presented 1:3-XOP long setup is 35.66$.
A stronger countertrend according price and time - ... perhaps oriented to the 21 Fib number!? - is usually able to test the 50% Fib retracement of 2016 high-2017 low cycle. 50% Fib retracement resides at 35.66$ and this that natural resistance level could be tested at the end of a 20-22 week countertrend cycle.
==> Midterm uptarget for the 1:3-XOP long setup is 37.44$.
IF! 2017 low finally! is in, XOP, of course, should advance or tend in slightly bullish sideways fashion without making another lower low on yearly base until year end, perhaps testing the 61.8% Fib retracement at 39.21$ at end of a multi-month countertrend. It`s quite interesting that the 61.80% Fib retracement is in symmetry to natural existing first square line resistance. Together with Resistance Angle and lower line of 2nd double arc upmagnet, XOP shows major important future attraction price at 39.21$ for mid to end of January 2018.
==> 39.21$ is derivable weekly quadruple upmagnet for XOP = the most attracting future price = the most attracting and strongest future resistance.
We should try a long at 31.40$, there the falling lower line of 1st double arc is for next week candle. It is only logical that such important trail should be tested back if this week will close above the lower line of 1st!
==> 1:3-Buy-Limit order at 31.40$. Buy-Limit order is valid till next week Friday, 28th of July 2017.
==> Please place the SL for the XOP-long attempt at 30.00$!
Risk = 1.40$. Potential reward = 4.24$. Risk-reward ratio 1.40/4.24 or 1:3.03
GUNNER24 Trade of the Day orders for 07/21/2017:
Market: SPDR S&P Oil & Gas Exploration & Production ETF
(XOP)
Orders: Buy-Limit at 31.40. Stop-Loss (SL) at 30.00. Shortterm uptarget is 35.66. Midterm uptarget is 37.44. Buy-Limit order valid till 07/28/2017.
Eduard
========================
Be a part of our exclusive sworn GUNNER24 Trader Community – now... I try to make you rich!
- with daily trades – quick, safe and profitable…
- in well-chosen precious metals, commodities, indexes, currencies and in the best stocks worldwide...
- in both rising and falling markets…
- with little use of capital…
Be prepared!
Eduard Altmann


