Sometimes, there are e-mails sent by traders who want to know of which criteria I choose the markets to be presented in the respective free Sunday forecasts. Well, my catchy answer to that question is this one:
Because A) I assume that I found some profitable, longer-lasting moves for position trading. And B) I presume some short-term, hefty resp. quick swings and possibly due important turns at determined changing marks that I C) summarize literally "immured" in the free GUNNER24 Forecasts to get – as I hope – a detailed trading plan and a mnemonic for the coming days/weeks/months I can steadily draw on.
D) Per se, I don’t care at all about the market that copes with getting into the free forecasts. The main point is that its future moves promise to me and thereby to you as well, I hope some pretty safe and profitable trading chances.
So, let’s start with gold now that once again reached important crossroads at the end of June and at the beginning of the new month of July.
… to me it`s not clear actually if gold INDEED FINALLY, which means in this case DECISIVELY, has broken above it´s 5 to 6-year long bottoming resistance area which is a very wide horizontal area, radiating resistance on the yearly chart starting from around 1355$ lasting up to about the 1424$.
For calling a successful breakout that INDEED FINALLY is cemented – which would signal a gold at 1480$ up to 1515$ or so within next 3 to 5 months and some more higher prices to expect for 2020 -, the gold has to close on monthly closing base at least once above that very wide spread yearly threshold band.
Since that wide resistance band has been working for so long, it normally takes 2 CONSECUTIVE monthly closings above 1414$-1424$ to become a hundred percent sure of a successful !!! breakout !!! above 6-year determining resistance.
In my opinion, it is fact that JUST 2 CONSECUTIVE monthly closing prices above 1424$ does signal the final end of the gold bear market as long as GUNNER24 Trading Method is concerned!
All 3 GUNNER24 Monthly Up setups I present and analyze below start measuring at the lowest price of the bear market which is December 2015 Low. The first setup measures upward into final high of 2016, which is major important countertrend high and is/was most important high of the years 2016 to 2019 up to mid-June or so.
The second one tracks into final high of 2017 and the last one ranges from # 1// 2015 Bear Market Low into final high of 2018. So, any of the 3 up setup tracks a range from a year low or most important low of the past 9 years into a printed final yearly high.
So we always measure from 9-year support price to a year resistance price and that`s why any of the GUNNER24 Setup Items below always automatically could radiate resistance area on yearly base.
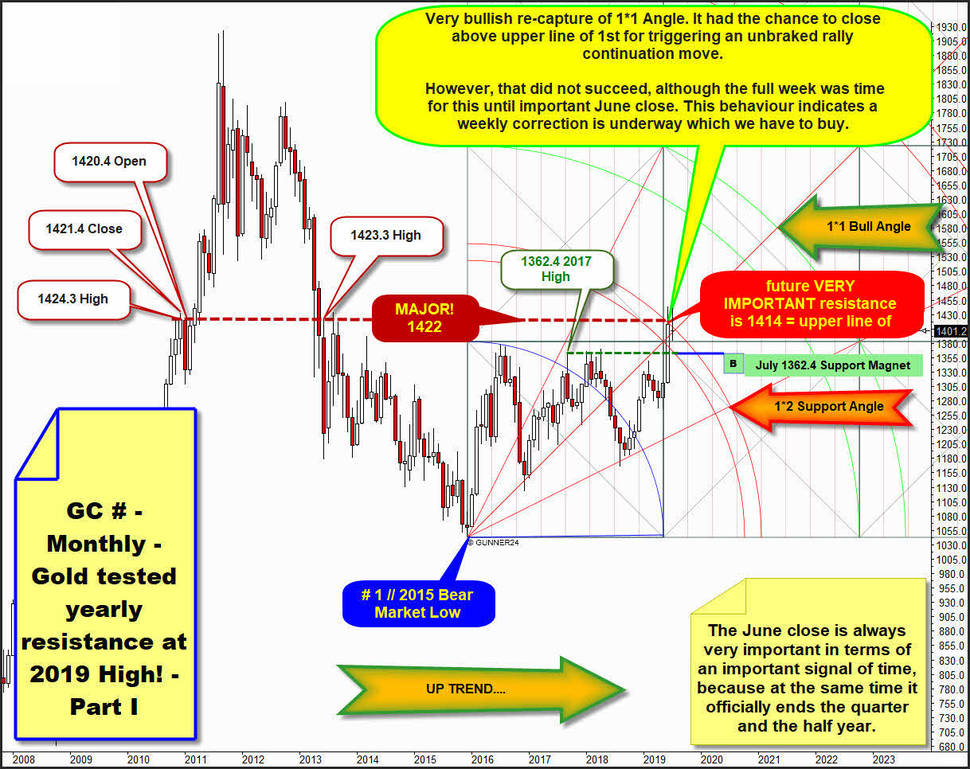
Gold tested yearly resistance at 2019 Highs - Here Part I:
First of all gold is in strong uptrend. June candle is second best gainer on monthly base since # 1 // 2015 Bear Market Low and closed near the highs & - very bullish - broke 2016 to 2018 highs and prior 2019 highs decisively to the upside.
The June close is always important because it ends month, quarter and half-year. And closing the half-year at highs is of course very bullish, so we have to expect higher highs in course of the second part of 2019 with a 80%-90% likelyhood.
However you recognize that natural uptarget of that setup is now worked off! And the 1st double arc area has radiated resistance not only at June, but also at this month July highs!
1st double arc above at least radiates monthly closing base resistance. And perhaps even is now stronger yearly double arc resistance for the months to come! And I see that 1414$ is very important future monthly closing base resistance because June denied such close although there was a good chance to do so. June 2019 closed at 1412.50$, so it was braked by upper line of 1st which for June candle stood 1414$, and that`s why perhaps just the first – better 2 consecutive closings above the 1414$ - likely will be the signal that 6-year long bottom resistance INDEED is finally/decisively overcome.
But nevertheless... gold momentum in the monthly is strong, breakout attempt looks fine, so we have to buy a dip, and I think a backtest of lower line of 1st double arc will be the best the bears are able to achieve in course of July!!
There and then the lower line of 1st double arc, now usually strong monthly support, unites with 1362.4$ horizontal support out of final 2017 high. And thats why we have to place a long-entry at 1362.4$, which is major support magnet, valid for entire July.
Any gold analyst, most Gold Bugs and any Big Boy is firm with the 1350$ up to perhaps 1380$ which is often negative tested 2016-2019 resistance range. So, a 1362.4$ support magnet test in course of July would mean the full backtest of that very important range according price and time.
Entire world is waiting for a full backtest of that range to go long. You are with me..., and that´s why such full backtest or monthly dip into 1350$-1380$ initial support range might not come true.
Because the mass of traders and investors usually is always wrong! But it may be that we are allowed to experience the full backtest. Why:
A) 1st double arc above is at least confirmed monthly resistance, so that resistance could radiate for at least some more weeks. B) Current 2019 High is harvested on June 25 and this is close to June 21 summer solstice which is always important possible turn signal according time in the commodity trading business.
C) Perhaps the at June and July highs seen 1422$ backtest will be a very negative one in the end. Please watch carefully that this 1422$ is most important resistance line of the 6-year-bottoming process we are able to recognize. I have highlighted some important closings and highs of the past, illustrating that this last bear market-ressort likely is nearly precisely at the MAJOR 1422$!!!
And this is why I think it normally takes 2 CONSECUTIVE monthly closings above 1414$-1424$ to become a hundred percent sure of a successful breakout above 6-years running determining resistance! Sic.
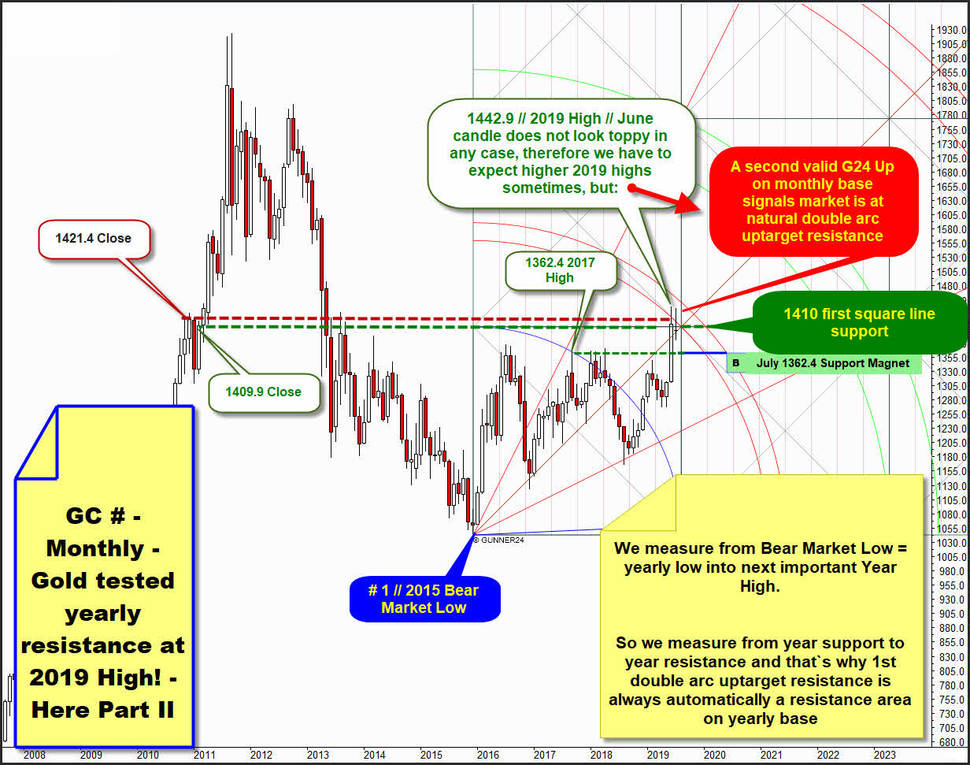
Gold tested yearly resistance at 2019 Highs - Part II:
Setup measures 2015 Bear Low ==> Final High of 2017, the price we should try a Buy the Dip long engagement in course of July.
Recognize and count that the Blue Arc measurement of that 2 year range offers very important 1st double arc uptarget is now finally reached and worked off and that`s why 1st double arc COULD radiate double arc resistance for the months and years to come.
Thus, we already count two valid GUNNER24 Setups, within the gold has hit annual resistance at 2019 highs. Therefore, a downturn starting at seen 2019 Top could be a deeper one, as far as the price is concerned. In this sense, an entry at 1362.4$ is quite safe thing cause a more or less serious backtest of 2019 highs would be usual reaction after a first initial drop.
Positive is that the June candle was able to close above 1410 first square line, so this horizontal now has morphed to at least very weak monthly support (horizontal)... and thats why the very first or second close above 1414$ perhaps will be the very first sign of a successful, sustainable breakout, in which case gold usually hast to test – at least – 1480$ to 1515$.
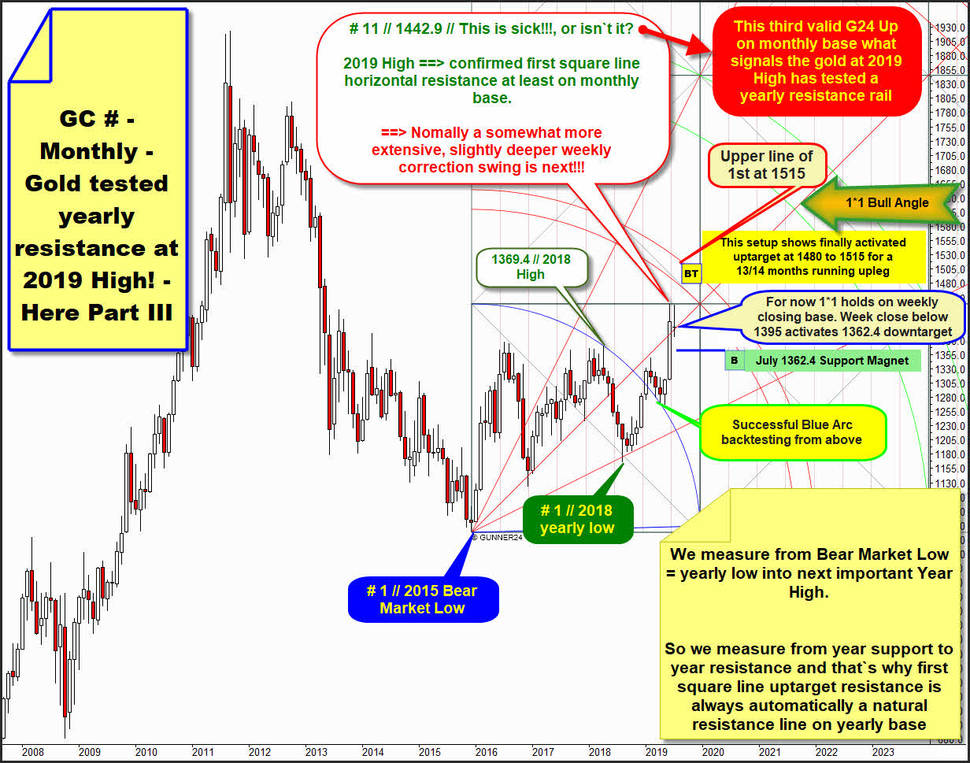
For this watch that baby - Gold tested yearly resistance at 2019 Highs - Part III:
Setup goes bear market low up to final high of 2018.
The 1442.9$ current 2019 Gold High exactly tested first square line resistance from below. So we have 3 different valid monthly GUNNER24 Up Setups which in combination fire that printed 2019 High was at yearly resistance magnet, yeah, even 100% accurately tested yearly resistance from below.
And this is very rare GUNNER24 Combo Stuff – an initially very bearish GUNNER24 Resistance Observation for midterm and longterm – what allows a deep retracement according price and a long retracement in course of July before rally or uptrend or whatever we recognize actually will/should/could resume.
For now it looks like that gold the entire July wants to form a bull flag on the weekly chart respective a triangle pattern in the daily chart, before uptrend will finally resume. Because for entire July the gold might be caught within lines of 1st double arc within at the beginning presented monthly 8 Candle up.
==> And the uptrend should resume!! With a very high probability! This tells us the gold price compared to this last seen setup. AND addtionally THE running UPTREND COUNT that starts at # 1 // final low of 2018 which was at 1*2 Angle yearly support out of 2015 Bear Market Low!
Count including July candle is that the gold is at uptrend month # 12, and when uptrend months # 11 and # 12 have been able to trade far above 3-year resistances and # 11 finally closed bullish near absolute year highs, then we should be 80%-90% safe that uptrend has to continue into next comming Fibonacci number which is 13 = August, even # 14 = September = 14 – 1 = 13 Fib number, or it seems that printing at least one higher 2019 high at the end of such monthly upcycle is very likely.
And watch the bullish price signals above. In course of 2019 former Blue Arc was successfully broken to the upside, afterwards successfully tested back to the T at March and April lows, followed by the rally. This first overcoming of Blue Arc and secondly successful backtest of Blue Arc, alltogether in course of 2019 points to that this setup has perhaps a lot of influence actually when it comes to the perhaps most important signals and future most important GUNNER24 Items.
We know the succeeded Blue Arc resistance upward break at same time has activated 2 very important uptargets which A) are 1442.9$ first square line, now finally matched and B) the future work off of 1st double arc in trend direction. A 1st double arc work off in trend direction has 75% odd or so in this case!!
==> This third presented GUNNER24 Up Setup tells us that gold is positively backed by upforces or ongoing bullish energy until sometimes in course of 2019 1st double arc is or will be worked off in trend direction!
Adding recognized count ideas gives that this monthly upcycle could test and work off year 2019 1st double arc main uptarget resistance sometimes August to September, somewhere between 1480$ (= lower line of 1st/August) and 1515$ (= upper line of 1st/September).
So, I think this runner should at least reach a 1480$, maybe in course of August!!, before 2019 uptrend gets in real danger!
Consequently we should buy coming dips or pullbacks.
Well, another very positve is that June close decisively has re-conquered 1*1 Angle out of 2015 Bear Market Low. This pretty strong signal usually has to fuel the existing bull power and for now the July candle defends this 1*1 Bull Market support nicely, however a coming week close below 1*1 Bull Market Angle in further course of July could be the bear trigger that 1362.4$ GUNNER24 Support Downmagnet will be achieved and tested at July 2019 lows!
1*1 Bull Market Angle for July 2019 candle runs at 1395$.
Usually Gold Bugs also have to buy a next higher 2019 high, as small higher it may be, because current 1442.9$ cycle high obviously met heavy 3x resistance on yearly base and any small higher high as 1442.9$ points to a fast bull market continuation into 1480$-1515$ projection!
You best register with our GUNNER24 Gold Trader now. That’s where we oversee the optimal entries and exits for you. Especially in the difficult market situations where many factors have to be considered the Gold Trader is backed by the additional GUNNER24 Signals based on the combined 1, 4 and 8 hour setups to catch the optimum entries and exits.
The GUNNER24 Gold Trader will provide you with the critical knowledge you need to forecast and analyse the precious metals with the GUNNER24 Forecasting Method. All the GUNNER24 Trading Signals you receive real-time are based on the actual Gold and Silver Future. The NEW GUNNER24 Gold Trader is a must for every actively working investor and trader who wants to trade successfully in everyday trading. The insights you receive from the head trader Eduard Altmann (and discoverer of the GUNNER24 Forecasting Method) are truly amazing sometimes. I promise!
Click the button below and order the GUNNER24 Gold Trader - $39.90 US a month. For 201 members and up - $49.90 US a month.
Be prepared!
Eduard Altmann


