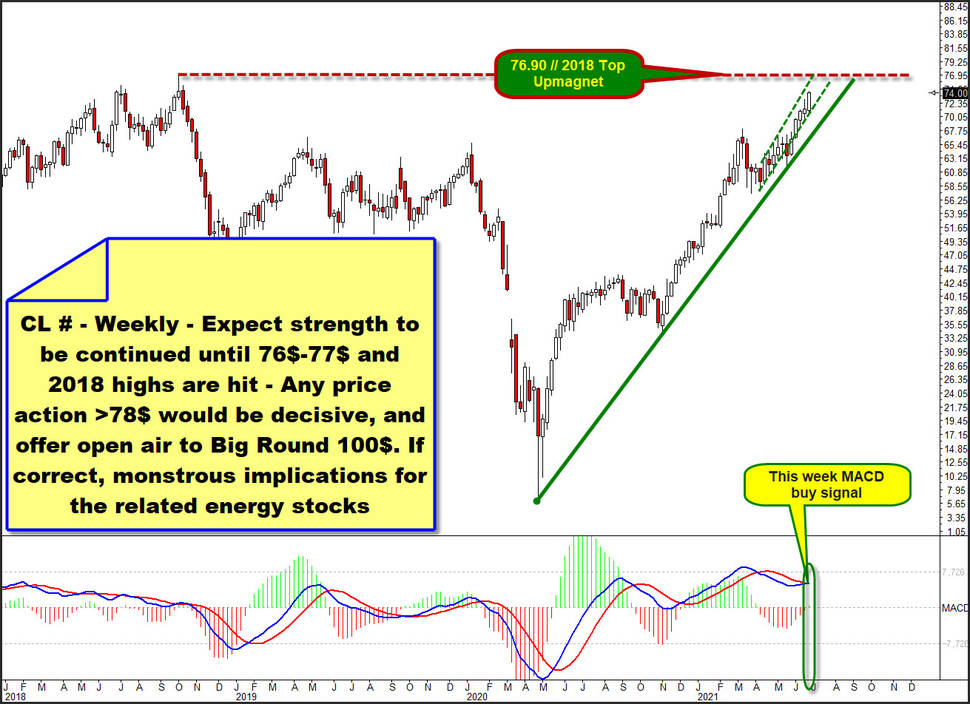
All Energy Markets are strong and expected to remain bullish until WTI Crude Oil futures contracts reach their next strongest upside price magnet. This will be the very first serious backtest of the key 2018 highs at 76$ to 77$ resistance area:
The 2018 crude oil highs are main horizontal resistance and now in striking distance with actual 74$. 76$ to 78$ area is a combined yearly & DECADE base resistance upmagnet.
The CL #, crude oil continuous contract is firing it`s next MACD buy signal here with this week candle which is now the fourth candle in a row to print higher 2021 highs. Expect the crude to rally further within the tight dark-green dotted rising bull channel until 76$ is hit for the first time what looks to be made sometime early-July!
==> All energy markets looking bullish. With corresponding heavy implications for the related Energy Stocks. And these were already the best performing sector of the S&P 500 this year anyway:
==> So for today I thought to myself that some of the most important Oil Producers must still have considerable shortterm profit potential! Leading Energy Stocks ytd performance:
OXY +88.6%
EOG +75.8%
XOM +55.8%
SLB +52.0%
PSX +28.9%
CVX +26.7%
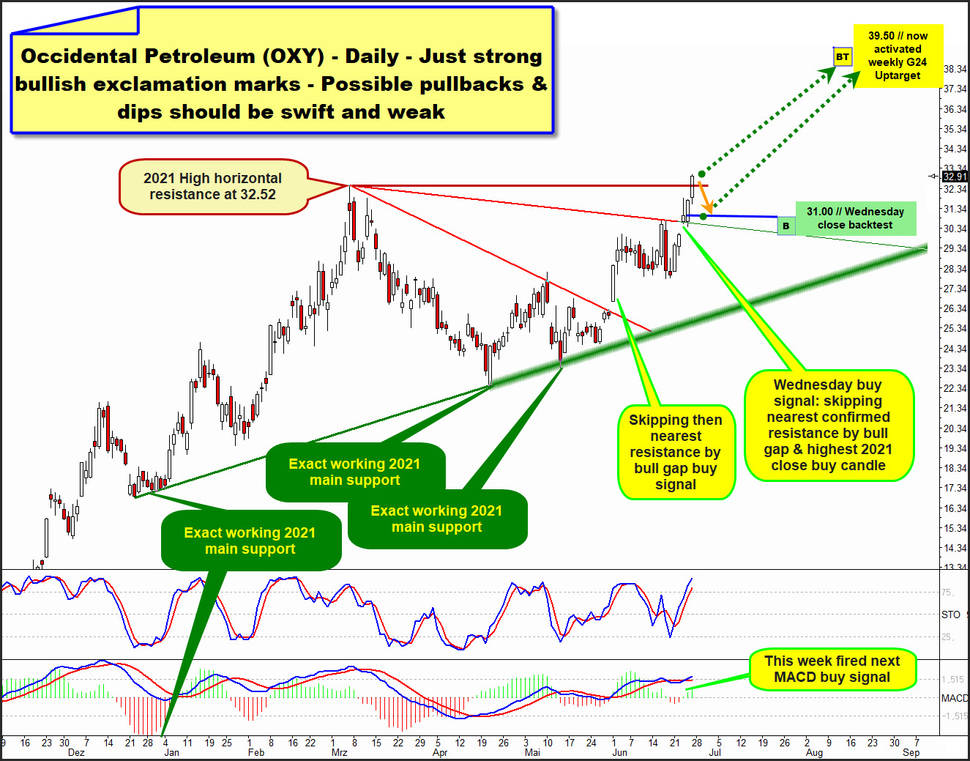
On Wednesday the outperformance of Occidental Petroleum Corp. (OXY) shares became obvious again as they delivered the so far highest daily close of 2021:
There is a bullish gap at Wednesday's opening auction what skipped then nearest redlined falling daily resistance to the upside. Together with til then highest daily bull market close the OXY shares on Wednesday fired a next strong long signal regarding the price, follwed by two more higher bull market closings into official week close at 32.94$. This bullish continuation and the seeing that the
1. This nearest (former!!) redlined falling daily resistance became successfully backtested from above at Thursday lows and open
&&&
2. The new bull market highs of Friday, what is the next strong bull market continuation on the charts
&&&
3. MACD momentum oscillator additionally fired a next combined histogram and lines buy signal must simply mean that it likely is the fact that the very last test of the unsual-straight holding rising dark-green 2021 main support triggered a daily and weekly upcycle that will very significantly overcome the important previous horizontal resistance of the „old" 32.52$ 2021 high.
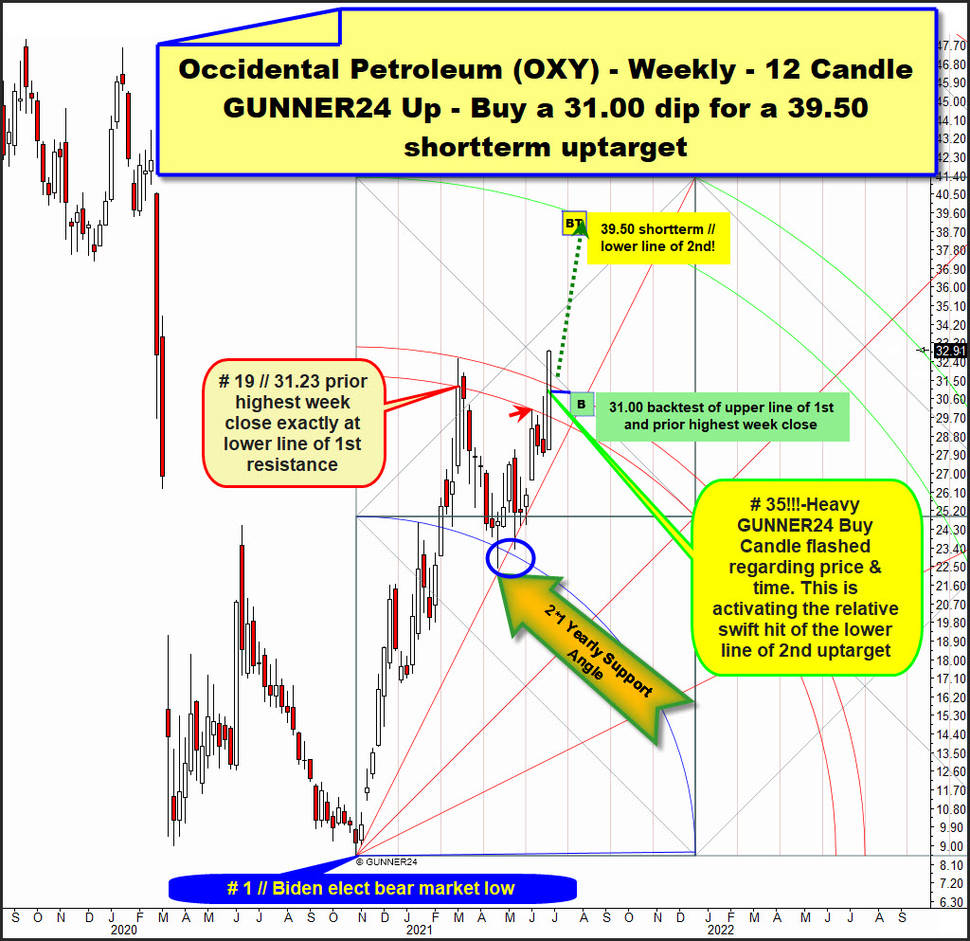
GUNNER24 Method now projects the 39.50$ uptarget work off within just a few weeks. Within at # 1 // Biden elect low anchorable weekly 12 Candle GUNNER24 Up we can clearly see what really happened on Wednesday after bullish gap. The price has been trading above the upper line of 1st double arc since Wednesday...:
... which was the determining resistance responsible for cementing the prior 32.52$ 2021 High.
Thus, this week's candle succeeded in closing above the natural and sharply-confirmed annual resistance of the upper line. Nothing else expresses this upper line of 1st double arc. Big resistance on year highs base, which is now being resolved to the upside! And this is an official GUNNER24 Buy Signal on a weekly base! The fact that this huge rally-week literally rallied from open til close reinforces the fired heavy buy signal on the weekly chart again!
Omnious is that the upper line of 1st resistance liberation is seen in course of the 35th bull market week.
This indicates that the price was held back, even slowed down, from the final crossing of the upper line of 1st resistance because of the 34-Fib number time magnet. Therefore, it may very well be that a really strong buy signal has now been triggered on the weekly chart, as a COMBINED price/time buy signal may have been triggered.
Such possibly underway heavy = combined weekly price/time buy signal activated the relative rapid work off of the lower line of 2nd double arc in trend direction. So maybe the lower line of 2nd will be hit or finally worked off sometime in the coming July 2021!
==> Combined buy signals on the daily and weekly chart point to a OXY-shortterm uptarget at around 39.50$, maybe due for the end of July 2021!
Just this little sidekick before we focus to the maybe best long entry point...: This bull market has been pretty perfect so far in terms of the above measurement of the up setup. After # 19-2021 Top found perfect main resistance at natural upper line of 1st, the shares pull backed for the nearly perfect backtest of the 2*1 Bull Market Angle which will continue to push the price higher til the very first weekly close below 2*1 will be printed. So the trading rule.
The downer from 2021 High nearly perfecty tested back the Blue Arc from above. At these mid-April lows the price dented Blue Arc support from above and at same time successfully tested back the 2*1 Bull Market Angle for the very first time.
That April spike low at same time tested back the rising daily 2021 main support and cause of this at April lows existing combined bull market support magnet the 2021 rally/bull market resumed strongly and was able to deliver higher bull market highs, likely followed by some more bull market continuation into lower line of 2nd double arc uptarget.
We know the magnets of the 19th bull market candle should be important for the future. First is, the # 19-former bull market extreme and prior 2021 High exactly was made at upper line of 1st.
Additionally we observe the # 19-close until Friday was the highest „offical week close" of the QXY Bull Run. The # 19-close exactly was braked by lower line of 1st from below. Therefore we have strong confirmation that the BOTH lines of the 1st should have some future magnet influence.
Former highest week close sits at 31.23$. The UPPER line of 1st magnet is very close to that 31.23$ for the coming week! Thus we calculate that this 31.23$ could become important stuff for the coming trading week, and can normally radiate stronger future support and probably now represents the nearest future support on the weekly chart!
==> I recommend to go long OXY shares with both hands at a 31.00$ IF hit within next 5 to 7 trading days!
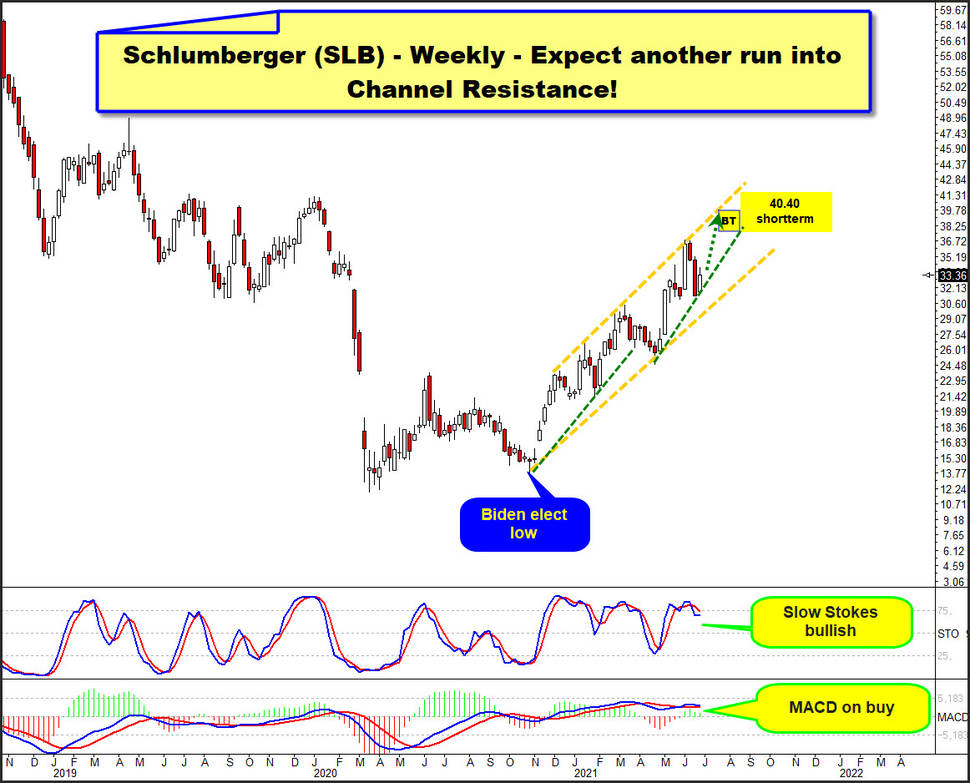
Schlumberger Limited (SLB), is the world's largest oil exploration and oilfield service company. The SLB shares price structure on the weekly chart since Biden elect cycle low, what was an important higher bull market low, is this orange-dotted Bull Channel:
This week made a higher low compared to past week candle and therefore we have received some stronger confirmation that a next dark-green dotted shortterm support line has formed within overall reigning 2021 Bull Channel. With weekly MACD still on buy and the weekly Slow Stochastics basing shy below oversold area a next daily upcycle for the next backtest of the Bull Channel resistance should have begun!
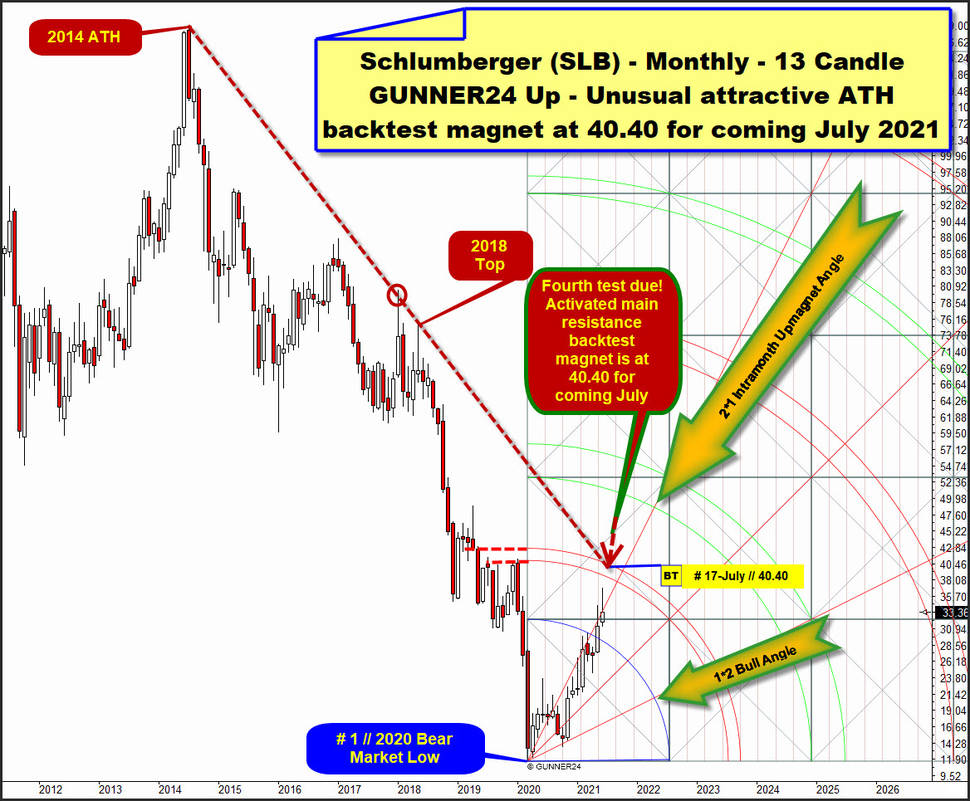
Activated shortterm GUNNER24 Uptarget is at a 40.40$. At 40.40$ sits combined monthly and ATH resistance upmagnet for the Jule 2021 candle. 40.40$ looks to be major important backtest resistance magnet for the SLB bull market which started at # 1 // 2020 Low:
Schlumberger shares respect their sharp-defined dark-red dotted alltime-high (ATH) resistance what starts at 2014 ATH and among other stuff depicts the final high of 2018 precisely. This steep falling main resistance is intersecting the possible monthly GUNNER24 Uptarget of the upper line of 1st double arc at 40.40$ for July which will be the 17th month candle of the new +1y bull market uptrend what was triggered at # 1 // March 2020 final Bear Market Low.
This ATH resistance & upper line of 1st forms most attractive nearest backtest magnet at above current 33.36$ and looks to be backtested quickly cause it is a combined ATH & lower year highs but also monthly attraction point.
This 40.40$ for July 2021 existing heavy attractive ATH backtest magnet should be the most plausible upward target for this monthly upcycle what started after 1*2 Gann Angle support kicked in at the Biden elect low price/time event.
The positive energy the shares radiate actually on the monthly chart is extraordinary strong. It is also a very young bullish energy boost that we can record on the monthly chart!, as the natural resistance of the Blue Arc within the textbook 13 Fib number Candle up was only recently FINALLY! overcome at the official # 15-May 2021 closing auction.
That final overcoming of the Blue Arc with # 15-May close fueled the bullish forces because the next higher resistance of the first square line now also appears to have been overcome by # 16-June 2021 open. June 2021 additionally opened with a monthly opening gap.
==> Shortterm uptarget is the combined main resistance upmagnet at 40.40$ sometime July 2021!
And perhaps the best expression of the current strength of SLB bull market is the sighting that the May and June candles try to overcome and violate the 2*1 Gann Angle, what still is the nearest main resistance ruler of this bull. So far the 2*1 Gann Angle acts as intramonth upmagnet for the price. For weeks there are daily and weekly closings above the 2*1 Intramonth Upmagnet Angle, which has so far been the overall main resistance, what this week close just shy below the 2*1 Angle visually illustrates.
We should expect the final bullish liberation of the 2*1 Gann Angle resistance. ==> This should happen relatively soon, as a fresh upward cycle on the daily chart has probably started! Therefore, in my opinion, the current 33.36 price area is a very good entry point into SLB longs for the worked out 40.40$/July 2021 GUNNER24 Shortterm Uptarget!
Be a part of our exclusive sworn GUNNER24 Trader Community – now... I try to make you rich!
- with daily trades – quick, safe and profitable…
- in well-chosen precious metals, commodities, indexes, currencies and in the best trending stocks worldwide...
- in both rising and falling markets…
- with little use of capital…
Be prepared!
Eduard Altmann

