I refuse to delve into the discussion about the effects of the Brexit in respect of possible political and economic consequences. For that’s what obviously everybody is doing: Politicians, system media, the Gullible Fritz. I don’t know exactly what is going on in your country. Yet here in Germany everyone knows everything better, anybody else but me is bearing the blame. Every person in front of a keypad or microphone is manifesting himself as the brightest bulb in the box, just like always. Everybody’s mangling everyone else without realizing the focal issues to some extent, nowhere near enough to make them subject of discussion or being willing resolve them.
==> Finger pointing of a furthermore unproductive chicken run instead of creative and fast approach to the problem concerning the EU malaise.
Myself, I approve the British – as a nation - to have been given the opportunity of struggling, of being allowed to shape big policy. I consider disgraceful bashing this people for something we all should avow for and we certainly all need now increasingly: The courage to make a tough decision.
==> Today, I’d like to go into some developments of the Brexit Friday. On stocks, gold, silver, currencies - the way I perceived them.
==> I’d like to dwell on the issues the System (financial system/central banks/politicians cast) is presently veiling, withholding, ignoring or being obliged to neglect. Let’s wait and see how long they persevere. I’d like to show some correlations behind the dark curtain that can only be perceived by someone who’s been in the business for as many as 20 years because he has developed a great deal of comprehension for the markets.
==> I’d like to bring home to my European readers and traders, but also to the GUNNER24 Fans beyond the sea – to them just approximately indeed – what happened in Europe on Friday… everything from my micro angle, showing the knife edge where Europe is certainly situated at the moment. And what the realizations of the Brexit Friday are supposed to mean for the stocks, gold and silver in the short term.
The FTSE MIB is the leading Italian index. It’s extremely leaning to the banks. That’s why it is – beside the respective Greek and Spanish leading indexes - the worst problem child in the EU:
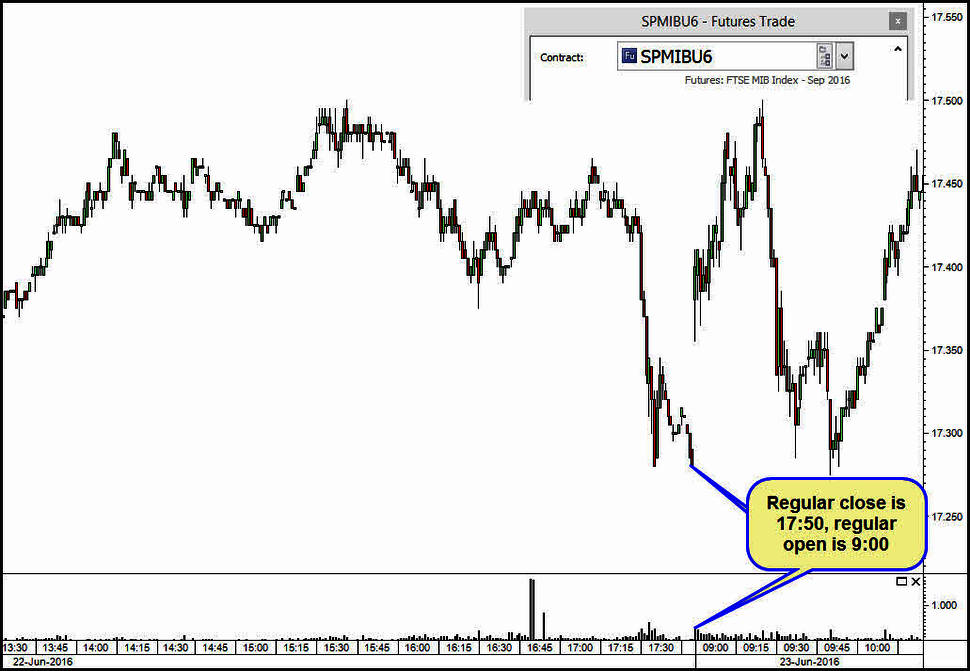
The FTSE MIB future regularly uses to finish the trading day at 17:50 CEST. Opening is always at 9:00 CEST. Just on the Brexit Friday, it didn’t open regularly. The way I perceived and researched the issue, the FTSE MIB was the only leading European stock index that had to open delayed:
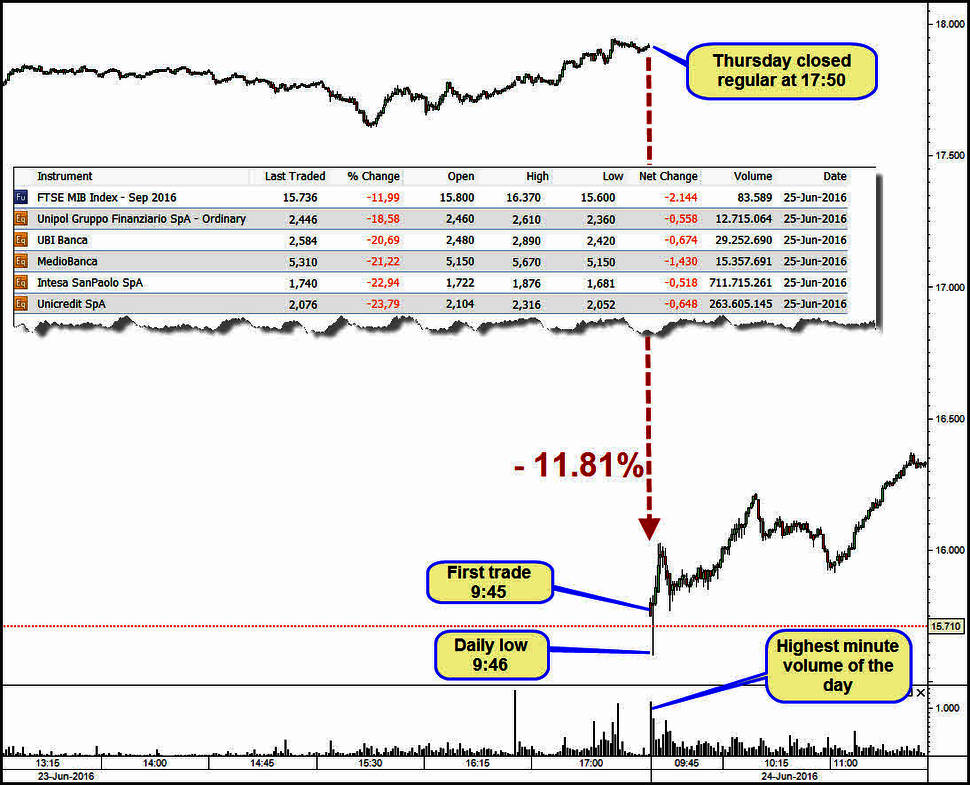
Last Friday, it opened with a fat minus of an 11.81% at 9:45 CEST. Afterwards, it closed Friday with a minus of an 11.99%. It was the worst session since 1994.
Here the figures related to former crash events: Lehman broke 2008 produced a minus of an 8.24%, 9-11 brought along a day minus of a 7.50%. In the chart above, I also anchored for you the day minus of a couple of important bank stocks of last Friday: -24% to -18.5%. Besides, the index contains many more banking stocks that show similar high day losses.
So, what happened in the period between 9:00 CEST (beginning of the regular trading) and 9:45 with other important stock market futures?
===> The FDXU6 (German DAX future) rose from 9266.50 to 9504.5 = +238 pts or +2.57%
===> The MFXIN6 (Spanish IBEX 35 future) rose from 7350 to 7813 = +436 pts or +6.30%
===> The ESU6 (S&P 500 emini future) rose from 2013.75 to 2035 = +21.25 pts or +1.06%
Actually, for all the EU stock indexes, with the regular 9:00 CEST opening, a very strong rally move started, significantly topping out for the time being at about 10:30-10:45.
Surprisingly conspicuous is the extremely harsh rally at the Spanish leading index. However: shouldn’t the normal investor rather search for "safe havens" like the DAX or S&P 500, why is one of the weakest EU stock market indexes being bought up so much? Buy on dips?
==> Because – as to my answer – the European Central Bank (ECB) is most likely to have backed up isolated the EU stock markets and – if necessary – bought them up by opening. Another clue for this: Have a look into the minute chart of the FTSE MIB once more. More than 1000 (highest 1 minute volume bar of the day…) contracts in the 2nd minute of trading are enough there to chase up the future out of a scrape.
The next step now within this consideration: Since the Spanish leading index smoothly rose by a + 6.3% during the 45 minutes while the Italian leading index was not allowed to open, we may certainly work on the assumption that the FTSE MIB would regularly have opened with a minus of -15% till even 20% at 9:00 CEST. Logically, some individual banks would have opened with -30% or even -40% in that case.
===> Just picture to yourself the possible panic in that event.
==> Picture to yourself how the European banks would have crashed. One domino after another would have fallen, thus throwing the world markets into the total turmoil.
==> I strongly suppose that not only the individual EU stock market indexes were backed up by a "European plunge protection team" just in time at the regular trading start, I also think that many individual bank shares across Europe had to be saved with support buying. Especially the Italian banks are extremely on the rocks. How much they are, is to be recognized in their day minus.
After all, the Bank of Japan (BoJ) was reported on Brexit Friday it would back up the Yen and the Bank of England (BoE) it would back up the pound if necessary. In addition, the ECB announced being "on the alert" after the Brexit vote. In my view, massive interventions by individual central banks are much more likely to have ensued on the early Friday morning already. The only one that admitted to have intervened massively on Friday was the Swiss National Bank that had to restrain the strongly upwards revaluated Swiss Frank.
Scanning the EU stock market indexes you’ll become aware of the Italian leading index to have closed near its opening and near its Friday low… This suggests that a very hefty disaster might still come to us from that corner…
Well, I think that the ECB may disguise, withhold and keep on working in the dark at discretion in order not to stampede the markets more. The positive thereon is that the ECB seems to have been prepared for the possible Brexit rather well. ==> Anyway, it succeeded once more in withdrawing the tumbling EU stock markets from the swamp, saving them somehow on Friday.
==> It was able to prevent the EU stock indexes from producing a Friday close near the day lows, thereby leaving at least something like chart-technical hope + simultaneously avoid the €-crash
==> The questions to be asked are: How long will they be able to sweep under the mat the emerged market turbulences? What will happen if the European banks keep on falling down the stairs? Lehman 2.0? Grexit 4.0?
====
I suppose that many markets are now in the confirmed so-called panic mode resp. panic cycle. These panic cycles normally last 7-10 time units, exceptionally sometimes even 12/13 time units.
What might happen with the stocks now? How low might they fall in this panic cycle? Example S&P 500:
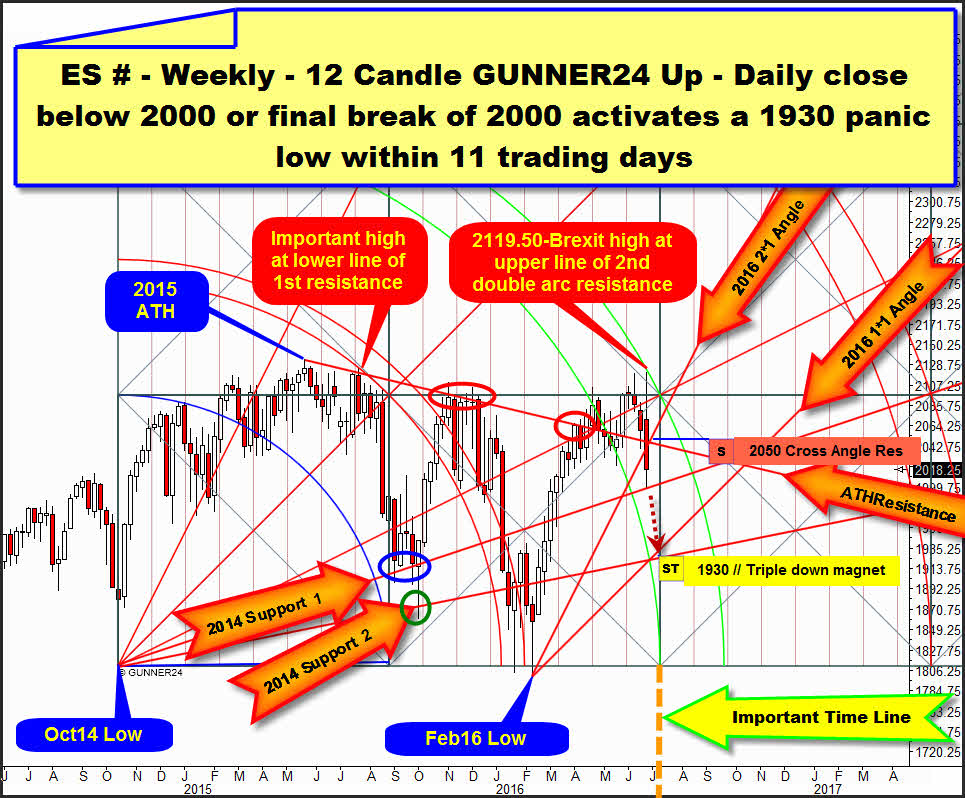
Above, you see the emini continuous future contract in the weekly time frame. It starts at the October 2014 low measuring 12 candles up. As an exception, today I chose the emini future for the forecast because this one – unlike the index – relates the incidents and impacts after the late Thursday high at 2119.50 pts with the time.
2119.50 is the attained Brexit high, made on Thursday 23 at 22:15 CEST.
==> Since the 2119.50-Brexit high bounced harshly from the resistance of the upper line of the 2nd double arc, it’s certainly matter of a very significant and important high.
==> At the beginning, the first precise test of the lower line of the 1st double arc resistance developed far less powerful downforces. All the same, it came to a strong downtrend in succession. Thereby, the attained Brexit high at the upper line of the 2nd may really imply much worse effects!! I mean, it may release the next tough downtrend…
==> The first test of the upper line of the 2nd double arc at the Brexit high generated now enormous downforces and also an important sell signal in the weekly time frame since the previously re-conquered ATH Resistance Angle was newly broken downwards vehemently. Furthermore, the 2016 2*1 Angle was smashed downwards. At the ATH Resistance Angle (starting from the 2015 all-time high=ATH) and the 2016 2*1 Angle (starting from the important February 2016 double low) it’s about extremely important supports on weekly base!
==> Current GUNNER24 Signal: For the next week candle, these two Gann Angles form an important cross-angle resistance at 2050 pts. In case the cross-angle resistance is reached/tested back until Wednesday, there will be the safe entry into a short-position for a new test of the current 1999 low.
I think, the panic cycle was at day # 2 with last Friday. On Thursday, the market was bought extremely upwards in a panic way – in order not to forfeit anything – and on Friday the Brexit sobering ensued, the first panic down day. Therewith, technically an upmove - ending then confirmed the panic cycle - cannot begin before next Friday, the 7th day of the possible panic cycle.
After all, a down cycle may always terminate with a final low, double low, small lower low and with a small higher low. So, there is thoroughly the possibility for the market of being for instance heftily sold off again maybe through Wednesday to start then a new up cycle with a small lower or small higher low next Friday at the earliest…
Friday = second day of the panic cycle came to its final 1999 low exactly at the 2014 Support Angle 1. At 1999, the contract sell-off was stopped per trading halt on Friday morning. After the end of the trading halt, the contract rose during the rest of Friday to close the week at 2018.25.
==> At 1999, as it were "somebody intervened" to "impede" the "short-term existing" panic.
==> Afterwards, "somebody" – the Fed??? - bought up the US stock markets as well. It would be absolutely absurd to assume that another, at least shortterm test of the 1999 would not have happened without any "unnatural" interventions. It would have been the natural reaction. But the US stock market futures as well as the EU stock markets didn’t even rudimentally test back their early Friday panic lows in the course of Friday!!
For me, two significations result from that. Since somebody backed up the broad US market indexes, the same somebody is supposed to keep on being ready to do so at a new test of the 1999 – to be expected as early as on Monday, at the latest on Tuesday.
If that somebody fails in defending the 2000 resp. the 2014 Support Angle 1, the ES emini will certainly keep on selling off pitilessly in the current panic cycle to reach its final low between the 7th and 13th day of the panic cycle.
The GUNNER24 Methodology detects a weekly triple down magnet at 1930. A strong attraction price for the recently started down move. For the week of July 4-8, the 2016 1*1 Angle, the 2014 Support Angle 2 and the next attainable important time line take their courses there. We always have to reckon with significant trend exhaustions and trend changes near/at these important time lines.
==> If the 2000 at the ES emini falls till Wednesday, the market will keep on cracking down in a panic way, I think. 1930 would be a logical cause natural target in that case.
============
Present assessment on gold, silver and the Gold and Silver Mining Stocks
I think, also in gold the ECB and the FED intervened actively in an adjusting way on Friday. Of course, it’s not easy for gold considering the rising US dollar, but hey – how frequent is a Brexit, and if the Brexit is supposed to imply a result it will be that the precious metal should close near the attained day high. Thus, the complete week should close near the attained Brexit high..., I suppose...
Unless that happened, at least the Brexit high reached at 1362.20 in the early morning should have been tested and confirmed as important with a small lower intraday high, a little more serious in the later course of Friday.
All this did not happen on Friday. The gold future closed by 40$ and the silver future by 58 cents below the Brexit highs. Gold in Euro reached a 1244.01 Brexit high, and at least it was still enough for the highest weekly close (1168.44) since April 2013!!!! Thereby, gold in Euro is now in a confirmed bull market according to the GUNNER24 Trading Method!
Gold in US$ succeeded in ending the week above the important 1322 resistance magnet. Certainly just scarcely above, but anyway.
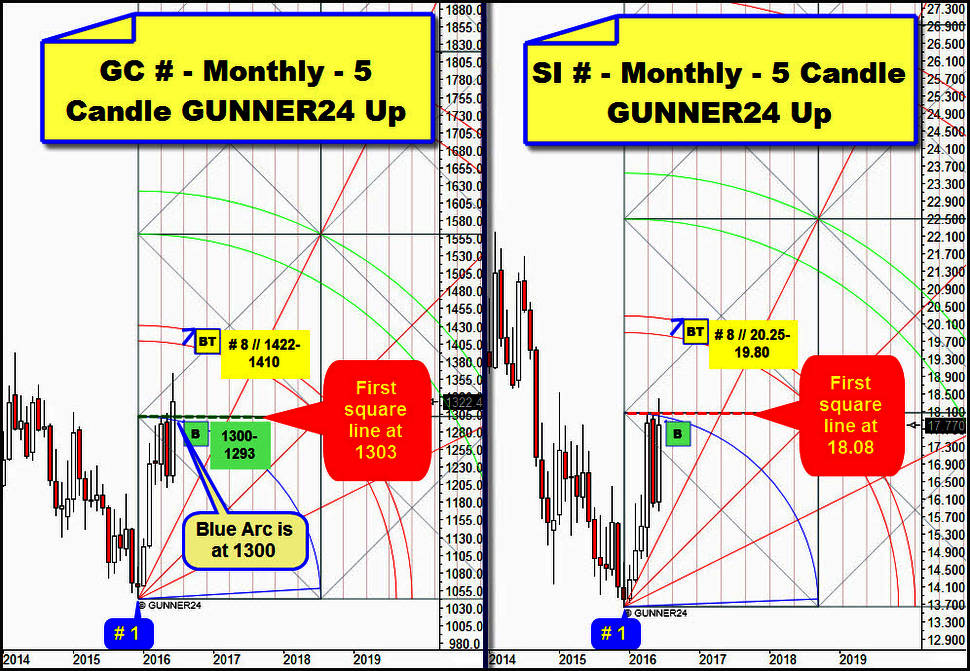
Last week, in the issue "The Good, the Bad and the Ugly" once more I pointed to the importance of the 1322. 1322 was obvious uptarget for the current gold countertrend and is most important current resistance in yearly time frame... and if overcome on monthly closing base this month till August 2016, the 5 year gold bear market will be over confirmed according to the GUNNER24 Forecasting Method.
See in the left monthly chart how gold comes adrift now upwards from the important 1303 first square line monthly resistance.
==> I firmly believe now that with the Brexit and the reached 1322.40 weekly close – the umpteenth consecutive buy signal in the weekly time frame – another strong upleg is confirmed now that is supposed to sustain gold till August then the 8th month of the new bull market up to the 1st double arc resistance.
==> New uptarget for gold is the 1410-1422 target area!!! Since the well-known authorities are still somehow able to brake gold resp. impede its rapid ascent, for next week a test of the 1300-1293 region will be to be reckoned with once more. Then and there, it will be rather safe to go long for the 1410-1422 till August 2016.
In the monthly time frame, silver – above to the right – doesn’t make any serious move to overcome its currently most important horizontal resistance at 18.08. Yet it’s not supposed to be able to escape from the expected further gold ascent. Thus, the present price level is a good entry for the 20.25-19.80 target region that likewise might be reached in August.
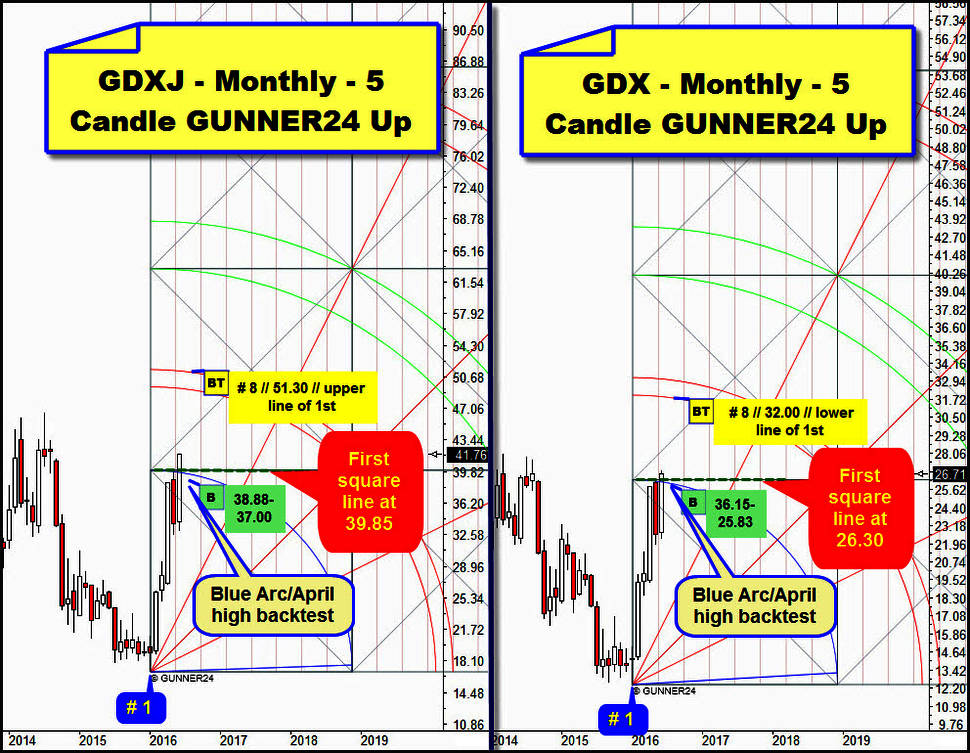
GDXJ und GDX confirm that the Brexit will have sustainable positive effects to the gold sector now:
After the executed Brexit and a consolidation period of about two months near the uptrend highs, both together are aspiring higher now. They are already trading visibly above the first square lines. After the Brexit, the gold juniors, in the chart left are clearly trading above the 39.85 first square line resistance. It’s a strong BUY SIGNAL that triggered the Brexit! Also the GDX on the right of the picture is beginning to break loose from its 26.30 monthly first square line! Buying zones for the next two weeks are to be found in the charts, so are the next higher target regions at the 1st double arc up magnet environment, triggered by the final Brexit.
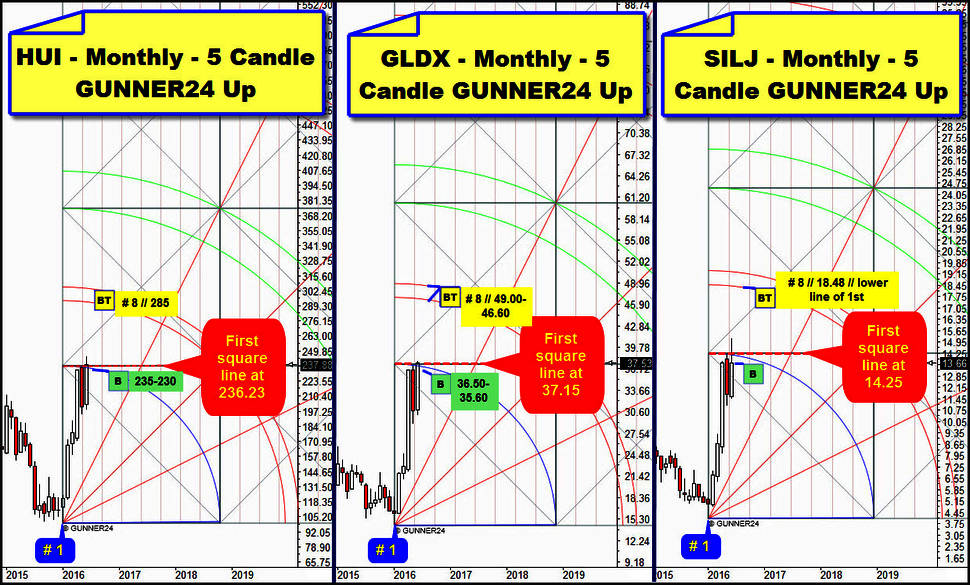
Current valid monthly HUI/GLDX/SILJ-GUNNER24 Up Setups:
Like silver, all three are still lagging behind a little.
It seems interesting that the HUI has not yet triggered the FINAL BUY SIGNAL for reaching the 285 points region in August 2016. Certainly, it closed narrowly above its 236.23 first square line resistance. Weekly close was 237.88.
On Friday, also the GLDX succeeded in closing above its currently next resistance horizontal in the yearly time frame. Narrow, narrow. They still succeed in curbing the mines, restraining them somehow. In case the broader stock markets start gasping again in the course of next week – it’s technically to be expected – the Gold and Silver Miners shall newly get started bad-ass!
Be prepared!
Eduard Altmann

