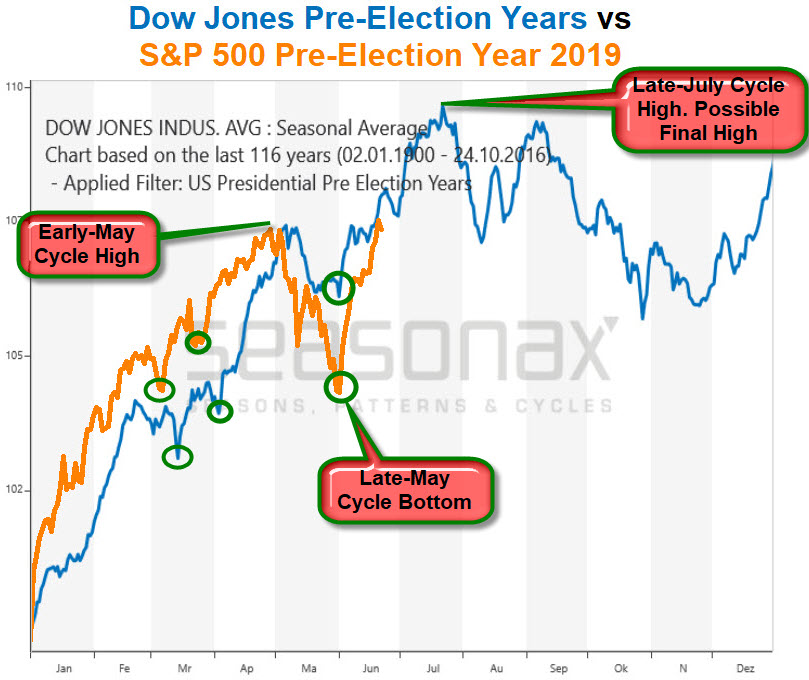
Since the beginning of the year, regarding important extrema and turns the US stock markets have been following the average pre-election year course in the US presidential cycle in a noticeably significant way.
In my opinion, the fact that the US stock markets comprehend the often very market-determining US presidential cycle only became apparent after the important late-May turnaround:

Source: http://www.seasonalcharts.com/zyklen_wahl_dowjones_preelection.html
The seasonality is speaking a plain language. In the chart above, the blue line represents the average Dow Jones Industrial Average performance of a pre-election year in the US presidential cycle from 1900 to 2016. And beyond any doubt this year 2019 orange S&P 500 course follows blue 116y-seasonal pattern closely.
Color-coded and emphasized by notes, you find the S&P 500 turns and important extrema in 2019 up today and since that mentioned late-May cycle bottom which nailed an important higher 2019 low which is in full sync to the "regular..." "always-coming..." pre-election year late-May turn date it became obvious what the market for us traders and investors still has in the bag.
A few more higher year highs, resp. some more alltime-highs and possibly a very decisive cycle high on yearly base, which "normally" will take place towards the end of July.
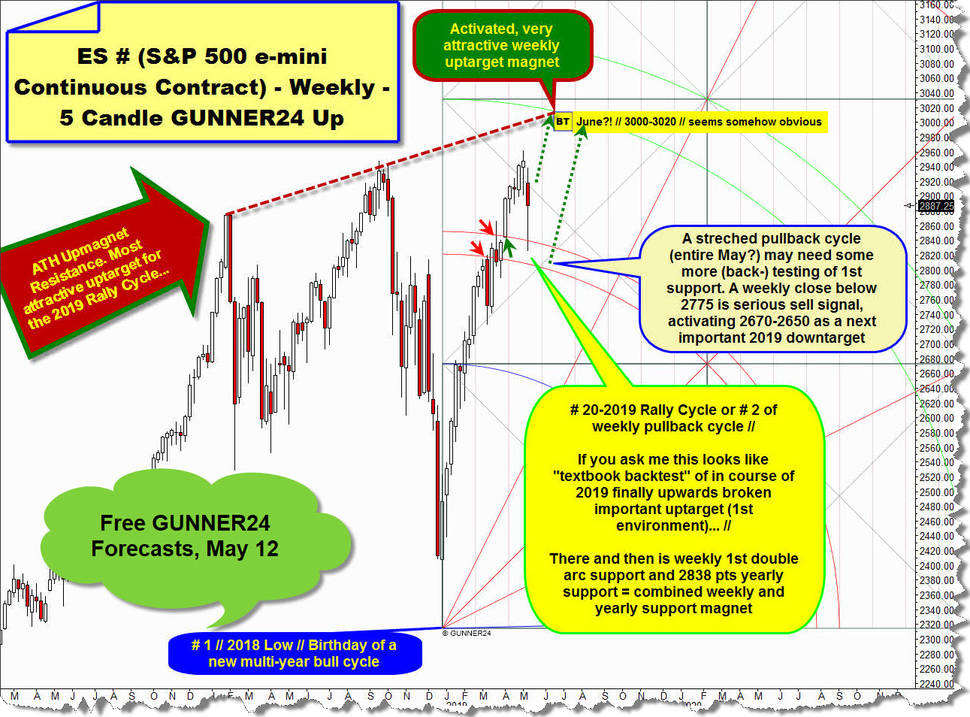
As far as the S&P 500 is concerned in a very special way, the very last GUNNER24 Forecast was that we should have expected the Big Round 3000 pts target work off sometimes in the course of June 2019. This can be difficult. Although the index on Friday made new all-time highs. Although market printed the highest week close ever:
Above you can see the bottom line of my recent public US stock market forecast based on the valid 5 week Candle GUNNER24 Up Setup of the ES #, S&P 500 continuous futures contract, published May 12. Back then we recognized market was in a pullback cycle which should correct some amount of first massive rally cycle out of final 2018 Low, there where a fresh multi-year bull market was born.
That at # 1 // 2018 Xmas low triggered bull market usually will run far into 2020 and has to test/work off at least 3250 pts. Pullback was expected to test 1st double arc support from above within 5 week Candle up according price. Pullback would have to go until the end of May, then worst case for the bulls, as far as the time factor is concerned.
However, the above 1st double arc support in May has fallen far short on weekly closing base, so that an important GUNNER24 Sell Signal was triggered. But its downwards goal was not processed. Before that began - just because of the market-determining US presidential cycle pre-election year seasonality - another strong rally leg which with next week candle will be at week No. 4:
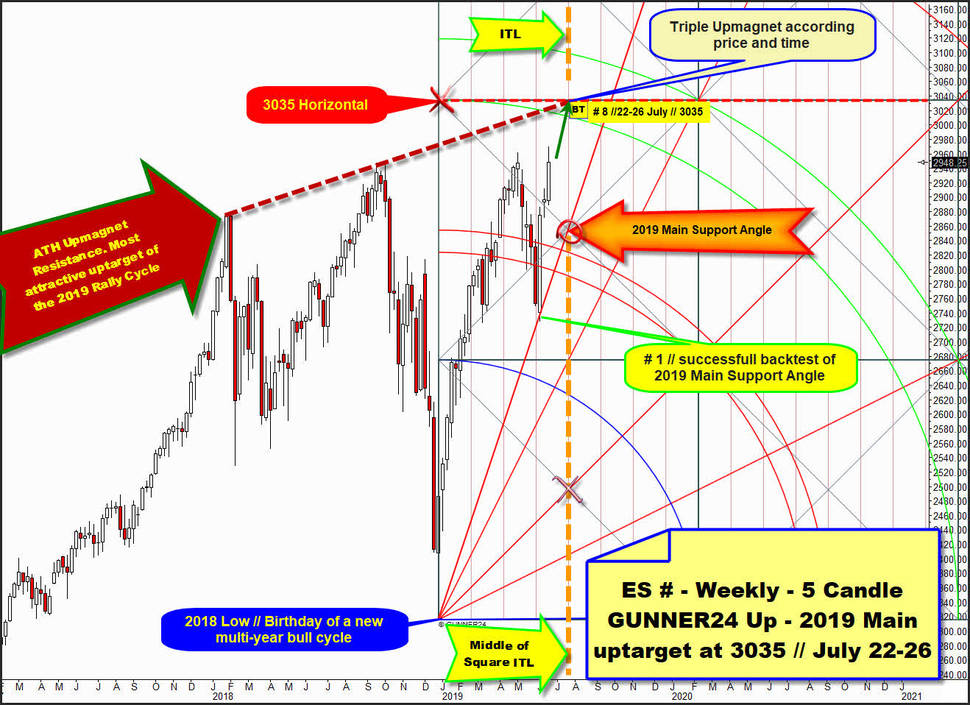
Above is updated weekly ES # candlestick chart, showing highest week close ever. Watch that # 1-low = equal to "regular..." pre-election year late-May cycle low found strong week low and weekly closing base support at within setup naturally anchorable Support Angle, I named 2019 Support Angle. This angle is now most important, strongest, lowest support angle on yearly base. That`s why even the very first weekly close below 2019 Support Angle signals that 2019 rally cycle has finally ended before and a new multi-month lasting bear cycle should be underway.
The at # 1-low triggered next 2019 rally leg is what it is; a next rally leg. Making higher highs, higher week lows and higher weekly closings and has to test of lower line of 2nd double arc as it seems after fresh made alltime-highs.
Lower line of 2nd double arc became very important activated GUNNER24 Uptarget in rally direction early April by overcoming upper line of 1st double arc resistance on closing base and, as it seems, it will be reached though via a juicy detour relatively timely, as expected on May 12.
However, I suppose the due lower line of 2nd and Big Round 3000 pts major uptarget work off probably will not come until the beginning of July. For now 2960 to 2965 remains main resistance area, but perhaps will be first time overcome on weekly closing base by # 5-close...
Hmm, in any case the very first weekly close above 2965 pts confirms again that Big Round 3000 pts W.D. Gann number/upmagnet is a necessity for the 2019 rally cycle.
On May 12, I expected market to trade at 3000 up to 3020 pts at June tops. This projection was based on the fact that the rising dark-red dotted ATH Resistance Upmagnet is one individual objective for the 2019 rally cycle and for end of June this very attractive backtest upmagnet and lower line of 2nd form very attractive = natural upmagnet. Next test of the rising dark-red dotted ATH Resistance Upmagnet sometimes in further course of 2019 is a "must have" for ES #, so to say. Before, the 2019 bull run can not really end finally, if you ask me...
If we now look again at the chart, taking into account the likely further development of the pre-election year cycle which signals a MAJOR HIGH close to the end of July (time) and also consider that the at # 1-low started rally cycle should be at the end of July at the important Fibonacci number, possible turn number 8 (time) and for the end of July time frame the rising dark-red dotted ATH Resistance Backtest Upmagnet intersects natural G24 Horizontal Resistance (price magnet) at exactly 3035 pts AND ADDITIONALLY end-July market will trade at orange-dotted important time line, represented by the middle of first square (time) ...
… we recognize very attractive future upmagnet resistance starting at 3035 pts for this rally.
==> 3035//end of July is MAJOR UPMAGNET RESISTANCE for the 2019 rally cycle!
And that`s why this is my call:
==> ES # is expected to test and work off 3035 pts in course of # 8-July 22-26! Then and there near/at 3035 MAJOR UPMAGNET RESISTANCE market is poised to print very important 2019 cycle highs, perhaps even likes to cement it`s final high of entire 2019. This option allows the determining pre-election year cycle!
Be prepared!
Eduard Altmann


