... or the possible options into the new 3500 pts alltime-high of the S&P 500 index.
After the US NASDAQ Tech Indexes euphoric bullishness at record levels with fresh new alltime-highs on Friday, the S&P 500 will now have to mark new all-time highs together with the Dow Jones Industrial Average as well. Mandarory and undeniable. According to our GUNNER24 System in course of August to September 2020, at about 3500 pts.
But before we look today at the most likely options that will lead to some fresh 2020 alltime-highs (ATH), a quick look back at this important S&P 500 analysis:
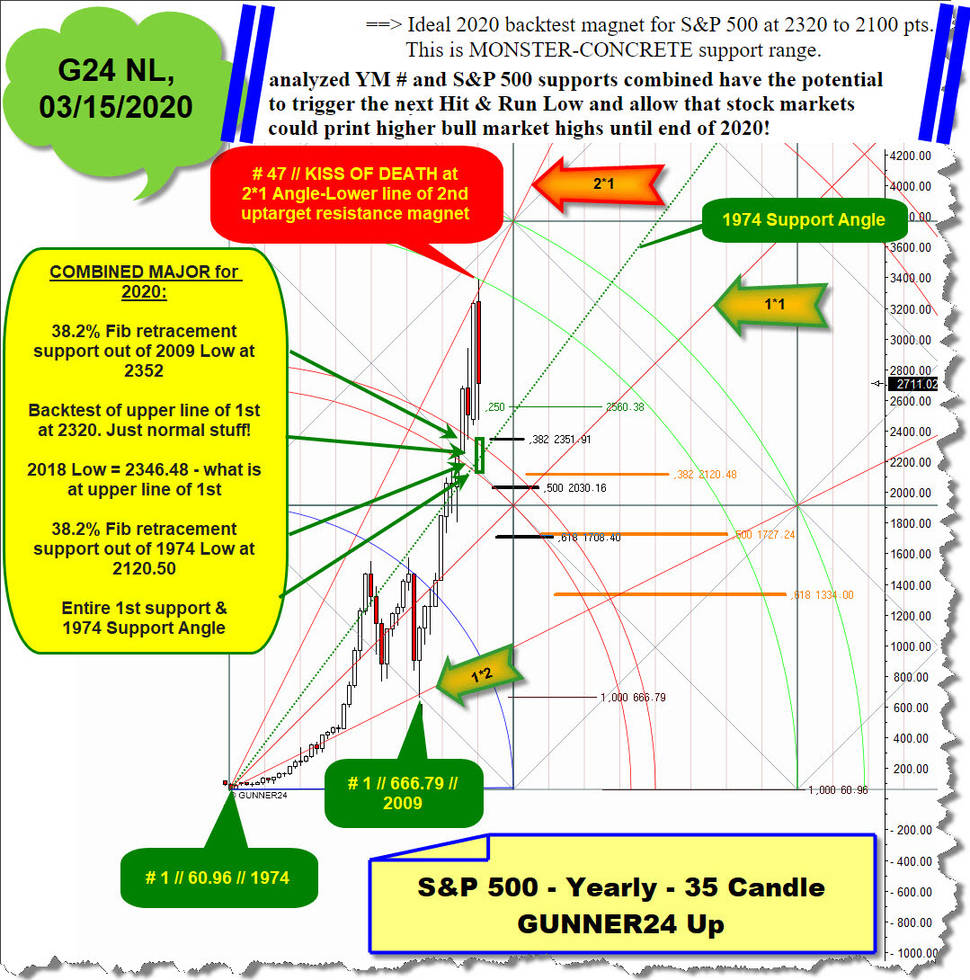
Within GUNNER24 Forecasts of March 15th, we analyzed with the help of the yearly S&P 500 chart and the yearly 35 Candle up of the S&P 500, that is was likely that Major 2020 lows should be printed somewhere between 2320 pts and 2100 pts soon and this support area usually should have the accumulated power that a next Hit & Run low for the S&P 500 could be printed and as a consequence afterwards:
A) the market at least has to countertrend hard for a 2900 pts, even higher for the „classic/textbook" Big Round 3000 pts backtest before a next serious downwave into the 2020 coronavirus-panic lows should follow.
Or B), ... as phat-blue anchored at the top of the picture above such a 2320-2100 pts S&P 500 Hit & Run low triggers a new monthly bull market cycle what will lead to fresh ATH`s later in the year.
==> And after what happened last week of trading, there is now a probability of over 90% that new ATH`s will be printed until end of September. It is precisely because the combined MILLENNIUM conrete support magnet at 2320-2100 pts (03/23/2020 low at 2191.86) was able to produce another important higher low in the overall bull run that is underway since 1974 bottom.
Something very special happened last week. In no other time in history has traders and investors been so complacent and fearless, and over-the-top euphorically bullish, and the S&P 500 climbs +5% in just five days. Friday alone market jumped +2.6% to a 3194 due to a massive jobs number surprise. This brave behavior is astonishing in itself at the retracement levels that have already been reached and for sure does not forebode well for the shortterm as market is overdone like hell and therefore now poised for a deeper and longer pullback.
However, this past week rally week is sustainable uber-bullish signal for the longer term.
For this I proudly present this monthly GUNNER24 Findings which should give us a trading advantage. As always when it comes to the analysis of the S&P 500, I use the data of the S&P 500 emini continuous contract (ES #):
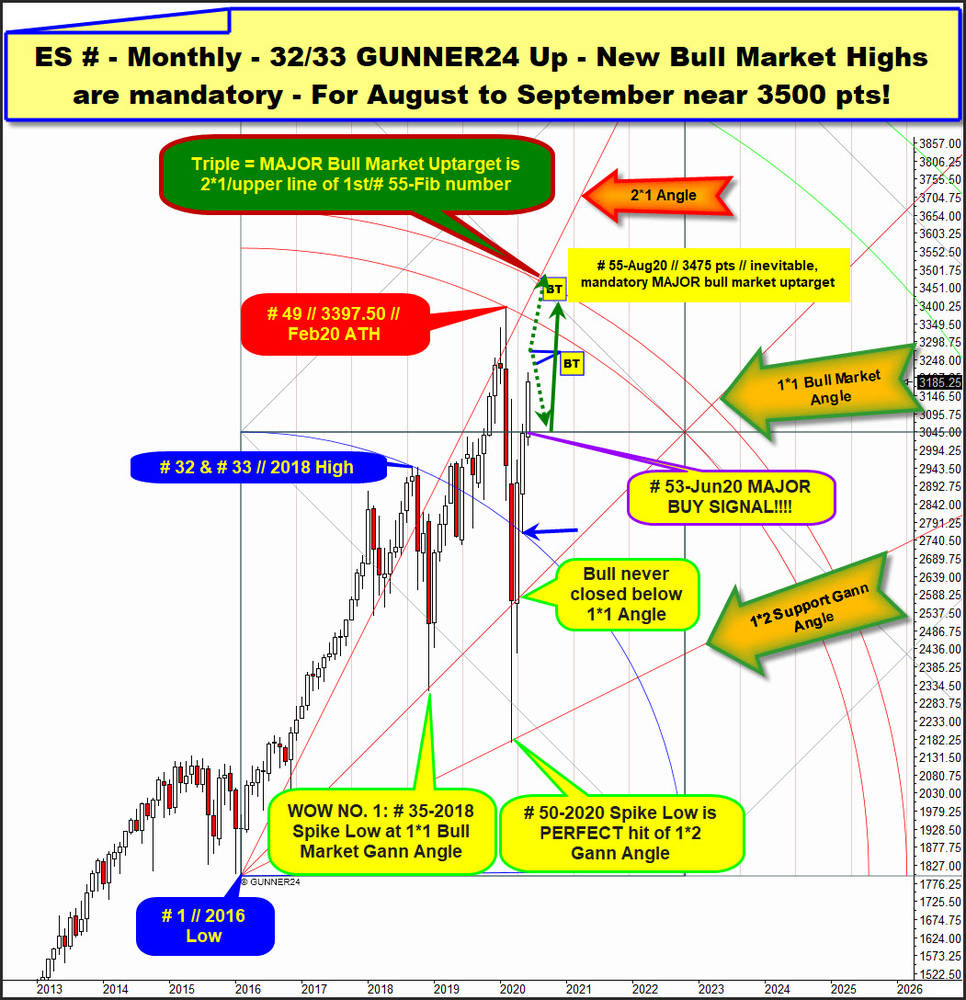
This monthly ES # chart with overlayed 32/33 Candles up setup starting at # 1 // 2016 Low is an epic poem.
It actually catches ALL of the most important extremes and turns of the last 4 years with pinpoint accuracy!
As there is first and of course the starting point of the bull market measurement, the # 1-final low of 2016. The measured upimpulse ranges towards the final highs of 2018, what occured at the top of the 32nd candle. Blue Arc additionally depicts the high of bull market month # 33. These monthly highs and that 2018 high is oriented to the 35 Fib turn number.
As the final low of 2018, the famous 2018 Xmas spike low is fully oriented to the 35 Fib turn number. This first important Hit & Run low of the bull EXACTLY tested back 1*1 Gann Angle from above.
Current ATH is printed in course of # 49-February 2020 and has 100% hit natural uptarget of lower line of 1st double arc (main = ATH resistance arc) out of # 32/# 33 Candle initial up impulse.
This natural bull market uptarget work off triggered fastest, hardest sell-off ever seen what finally bottomed at March 2020 and 99% accurately at 1*2 Gann Angle, printing next Hit & Run low of the bull.
OR ==> this setup accurately depicts the 5 most important extremes of the bull market what started 2016, whereby the 1*1 and 1*2 Gann Angles have been backtested VERY, VERY, VERY successfully to the T and 1*1 Bull Market Gann Angle never was violated on monthly closing base. & we now know that Blue Arc & 1*1 & 1*2 as 2*1 & lower line of 1st double arc are prior confirmed rails/items/magnets on yearly base.
Cause V-rally starting at #-50-2020 Spike Low in course of the week became strong enough to trade above ideal 2020 backtest threshold of first square line, natural yearly resistance horizontal, the backtest of lower line of 1st ATH resistance is now FINALLY activated – in V-rally direction... , what now itself states as the fastes, hardest V-shape recovery ever seen regarding achieved ES # points!
And much better for all the longterm bulls ==> since A) the count of the S&P 500 bull market – together with B) the fact that the US NASDAQ Indexes already have been strong enough to deliver fresh ATH`s – strongly points to outcome that the S&P 500 bull market month 55 Fib number will be the next bull market extreme to be printed!
Also as 1*1 Bull Market Angle has held on monthly closing base the V-rally usually has to test back the 2*1 Gann Angle in V-rally direction. Watch and please remember that the 2*1 is well-confirmed yearly and monthly resistance, but it is additionally future rising ATH resistance and natural major upmagnet for the bull as the # 49-February 2020 ATH was last negative backtest of 2*1 Angle from below.
Regarding the little bit bigger picture this is my next S&P 500 call:
An ATH near 3475 to 3500 due for the 55th Fib number month of bull run or August 2020 as there and then unite 3 future very interesting magnets on yearly base. The 55 Fib number major time signaler then meets the upper line of 1st double arc uptarget and the 2*1 Gann Angle yearly backtest upmagnet resistance. This next important ATH would also likely to be reached near 3500 in September 2020 as this then will be 56th month candle of bull - 1 = 55 next due Fib number in the sequence.
Above I noted lilac-yellow that the underway # 53-June 2020 prints a „MAJOR BUY SIGNAL!!!" As never should a retracement have been allowed to trade so far above the yearly first square line resistance and the monthly Big Round 3000 pts Gann number resistance. Therefore, from a regulatory point of view, the V-rally must be a completely new and the next sustainable upward wave in the ongoing yearlong bull market. Which normally lead to new bull market highs.
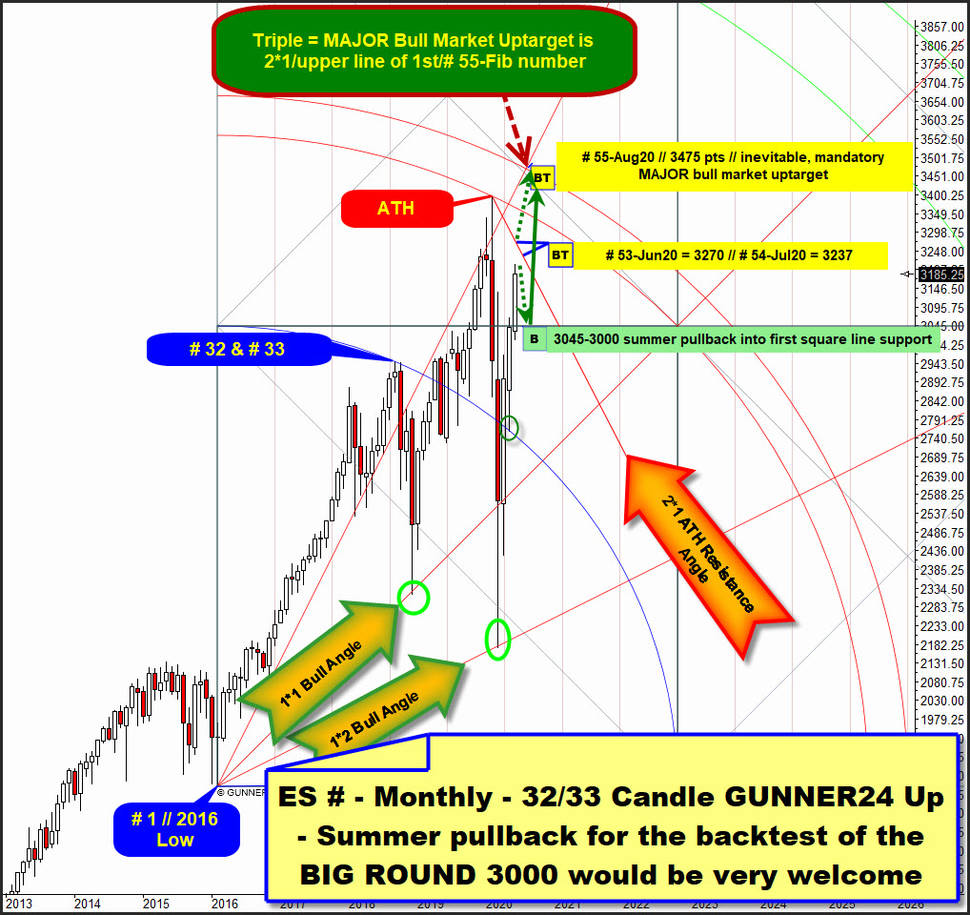
To make today's analysis round, I would like to discuss the most likely paths and important waves towards the 3475-3500 pts August-September alltime-highs. And thus, I would like to refer to the dark-green arrows within chart above and below:
Some very important GUNNER24 Stuff seen in the lower time frames and volume, momentum, chart patterns and the fact that the V-rally will be at day No. 55 Fib number on Tuesday points to the scenario that the next intermediate or shortterm top of the US stock markets will be printed Wednesday to Thursday timed with next Fed Chairman Powell speech.
Stocks are typically bullish the couple days in front of and into the Fed meeting, afterwards retracing the prior advances for some longer, even weeks.
After unusual bullish Friday surprise the bulls are obviously able to keep the stock market higher into # 55-Tuesday, # 56-1= 55 Wednesday-Fed day. Thus, the ES # bulls might be strong enough to test back the 2*1 ATH Resistance Angle in course of next trading week!
This nearest natural and at same time strongest ATH resistance upmagnet above current 3185 pts runs for this month # 53-June 2020 at 3270 ES # points. And there around the rally might top for some time. Perhaps followed by the downward placed dark-green dotted arrow what signals the normal & classic & backtest of the first square line and Big Round 3000 Gann number main support within weeks.
Usually and with 70% odd after a 3270 pts or so the ES # should sharply!! pullback for 2, 3 week candles into 3045-3000 pts, yearly horizontal support area, followed by the steep upward directed dark-green arrow what forecasts that after a possible sharp 3045-3000 pts pullback cycle the next full-pull rally cycle into # 55-August 2020 // 3475 MAJOR bull market uptarget should come true.
==> Think, if it will indeed test back the 3000-2990 pts until end of June towards early-July time window this will be the best the bears will be able to achieve ...
Or. This upward directed dotted dark-green arrow actually has just a 30% probability. The rally would continues without a sustainable weekly and daily pullback/correction into # 55-August 2020 // 3475 pts // inevitable, mandatory MAJOR bull market uptarget.
This option usually would mean in real trading that after the decisive overcoming of the 3270 pts on weekly closing base the easy part for the bulls has ended and after the lower line of 1st double arc main backtest objective has been reached and worked off the price advance should only move very slowly through the juicy resistance space of the 1st double arc until the 2020 MAJOR uptarget likely has been finally worked off.
Be prepared!
Eduard Altmann


