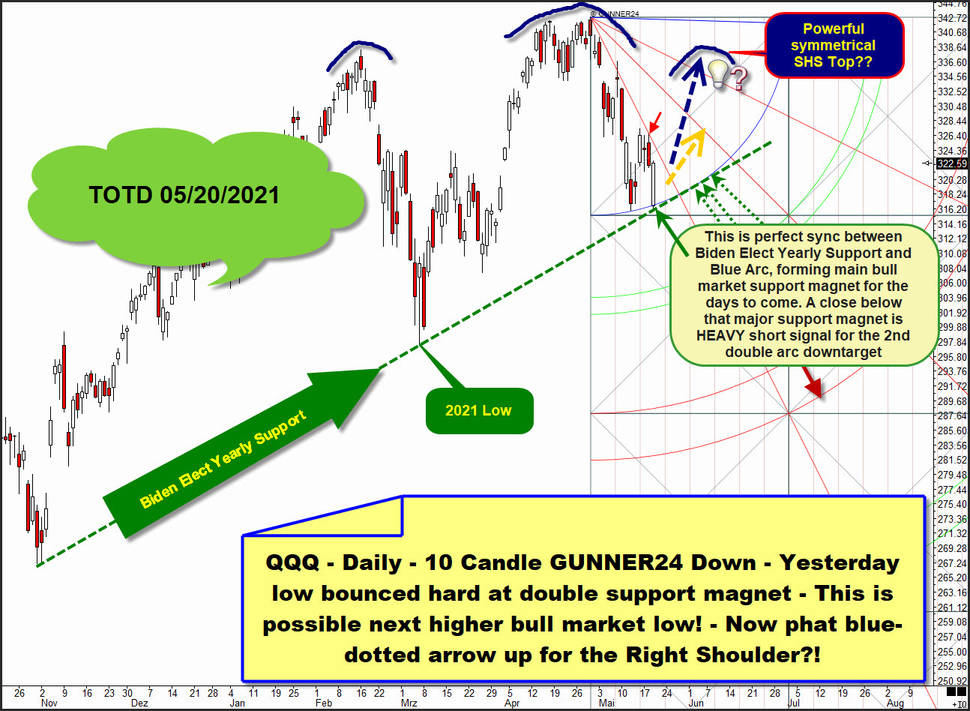
About 2 weeks ago (TOTD 05/20/2021) we had the strong presumption that the QQQ ETF was working on a sustainable symmetrical Head-and Shoulders (SHS) topping pattern, which should be close to completion by early June. Now it is early June and the Right Shoulder of a possible big symmetrical SHS top is close to completion:
Head-and-Shoulder tops offer you one of the best methods of selling a market. The more the left and right shoulders are forming at the same price level, the better it gets. Accordingly, the eagerly awaited correction in Tech Stocks could begin as early as the coming trading week, which brave traders could take advantage of with an acceptable risk-reward ratio.
At 338.50$ to 339.60$ is it where an usually very strong influencing combined weekly and monthly GUNNER24 Resistance Magnet forms for this next trading week:
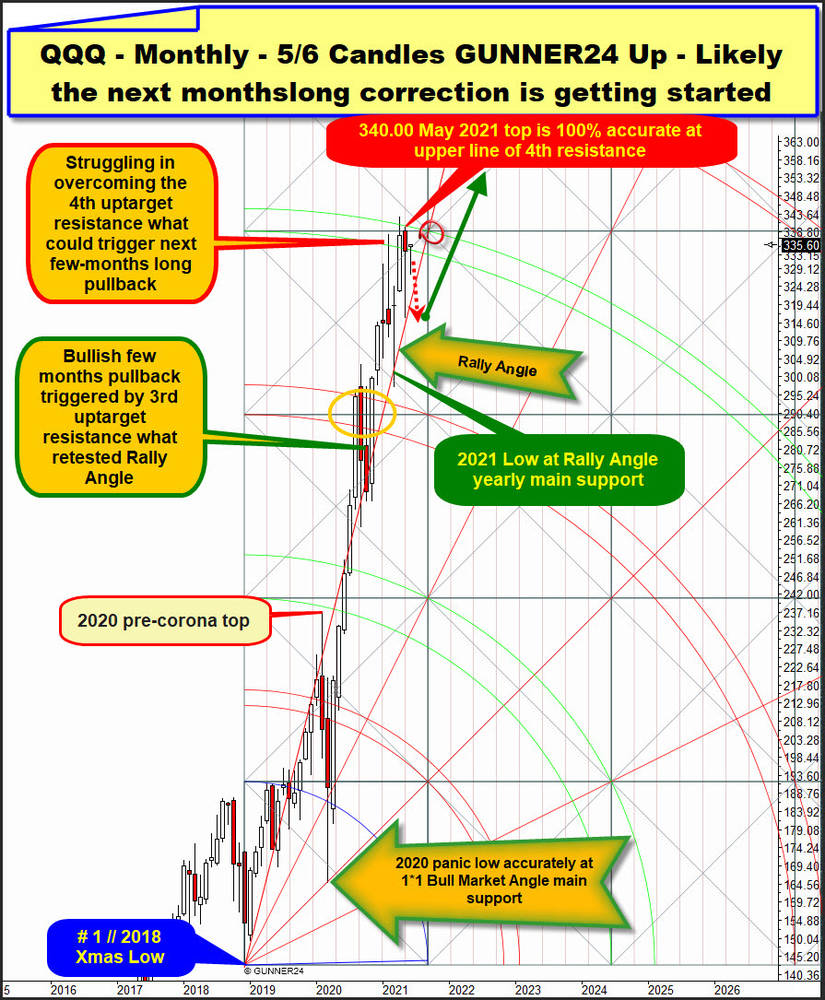
Above you recognize a monthly 5/6 Candles GUNNER24 Up Setup starting at famous # 1 // 2018 Xmas Low. The 2020 pre-corona spike alltime-high (ATH) has set in nice sync to lower line of 2nd double arc uptarget. From there the shortest but strongest bear market ever exactly tested back the 1*1 Bull Market Main Support Angle at 2020 coronavirus bear market panic low.
The there triggered 2020 rally paused for some months at the natural 3rd double arc main resistance point and important bull market uptarget area. November 2020 candle, what is the Biden elect buy signal, finally broke the 3rd magnet and the QQQ`s topped so far at next higher important GUNNER24 Bull Market uptarget of the 4th double arc.
April 2021 ATH`s have looked briefly above the upper line of 4th double arc uptarget resistance and the April 2021 was able to close within the lines of the 4th double arc what is preparation for why this now 3 times confirmed monthly main resistance = at same time 3 times confirmed year high & ATH resistance area sometime will be overcome and as a consequence in the longer future the 5th double arc upmagnet should be worked off in bull market (trend) direction.
Read my note that the May 2021 with a 100% accuarcy found the final top at the upper line of 4th double arc from below. This is why the upper line of 4th is now a very-good confirmed and above all sharp-defined monthly resistance rail. And we should try to short the QQQ ETF there around IF this monthly resistance is getting retested in course of the coming week!
Until today this 4th double arc additionally represents the combined alltime-high and the year 2021 resistance environment!
Market for the time window 2021 struggles in overcoming that 4th obviously! And now the summer months are due what traditionally is a weaker time period for Tech Stocks and maybe because history sometimes rhymes QQQ`s have the next 2, 3, 4 month candleslong correction cyle in front what perhaps must test back the above within setup naturally anchorable "Rally Angle" as this outcome was the case after the 3rd double arc environment turned out to be the former most important yearly main resistance.
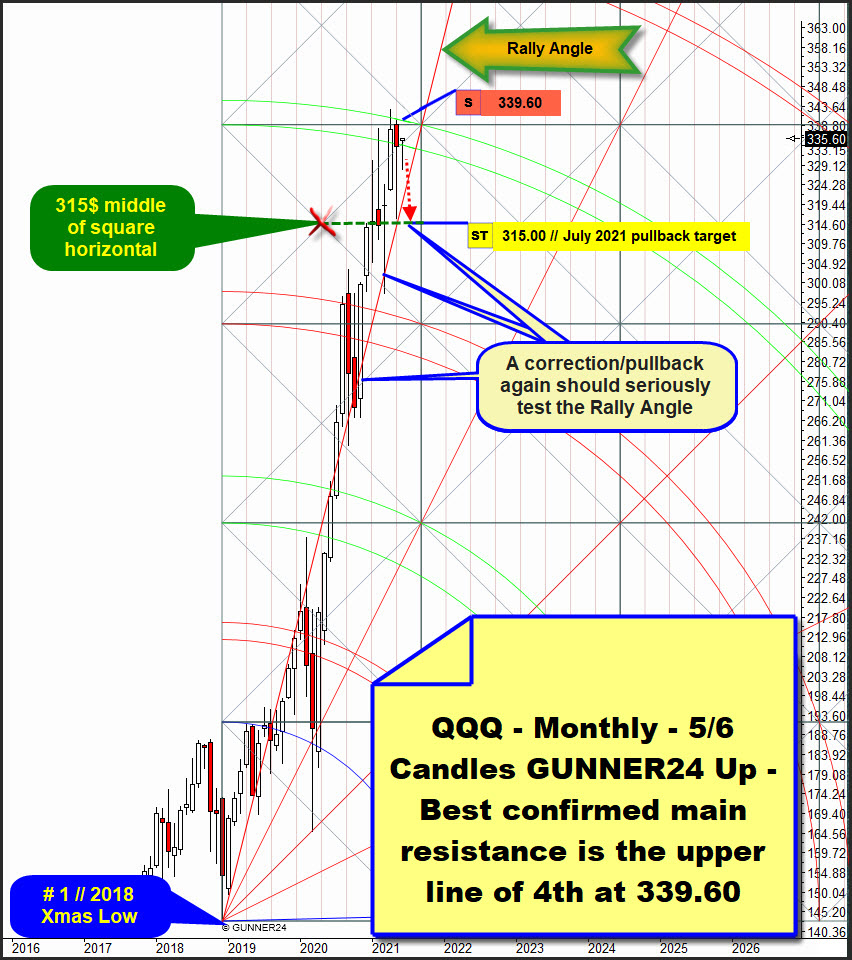
You may sell-short QQQ`s at a 339.60$ as there runs the upper line of 4th double arc resistance for the June candle, expecting a 315.00$ or so corrective cycle. A 315$ downtarget could be worked off sometime during July 2021...:
The 315$ is the nearest natural GUNNER24 Support Horizontal below and could provide stronger future support, but for sure might be nearest interesting backtest magnet on the monthly chart. The last two backtests of the Rally Angle have violated the Rally Angle main support partially by a large amount, and this is why also the next testing period of the Rally Angle could act in the same manner.
All in all, a possible 2, 3, 4 candles pullback cycle could already fall to the future 315$ horizontal without the main support = strong rising yearly bull market support of the Rally Angle giving way. Let's see...
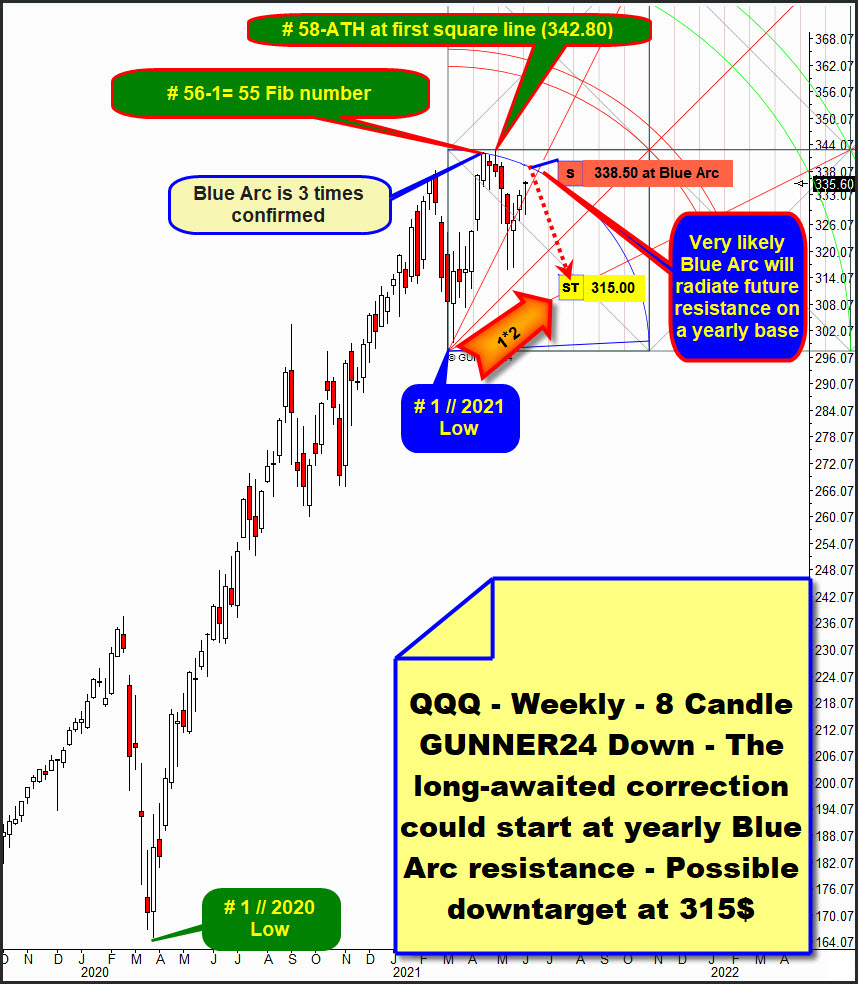
Below is the current reigning weekly GUNNER24 Up Setup starting at blue # 1 // so far 2021 Low what is printed early-March at the 297.45$. Watching the setup we recognize that the Blue Arc is not only a prior-sharp defined and well-confirmed future weekly resistance rail regarding the price. Additionally, it has morphed to a time factor main resistance as the 56th, as well as the 57th, as well as the 58th week candle of the bull market what started at the famous green # 1 // 2018 Xmas Low can be captured with the Blue Arc resistance almost OPTIMALLY!!!!
Therefore this Blue Arc above actually represents future main resistance upmagnet regarding the TIME and the price. It actually represents nearest yearly and alltime-high (ATH) resistance rail as it nearly ideally depicts the bull market range from blue # 1 // 2021 Low to so far 2021 Top. Whereas the so far 2021 year high was made exactly at the resistance and upward magnet of the first square line, which in turn indirectly confirms both, A) the chosen location of the above Blue Arc and B) the importance of this textbook weekly 8 Fib number Candle GUNNER24 Up very nicely.
Blue Arc above probably represent at the same time the currently next, most important main resistance rail of the yeaerslong bull market which started at the green # 1 // famous 2018 Xmas Low, because there at the Blue Arc an upcycle oriented to the 55 Fib number possibly ended finally or at least for the shortterm.
==> Very likely the Blue Arc will radiate some very strong yearly resistance energy at next test, and well for the coming week the Blue Arc runs at the 338.50$ and this is the point where likely some yearly and weekly and monthly resistances regarding time and price unite for the hopefully best Gentleman`s sell-short entry for the/a 315$-July 2021 pullback/correction downtarget!
You should set your profit ratio always at 3 times or higher your risk factor!
We achieve this by placing the Stop-Loss (SL) just shy above the current alltime-high what is at 342.80$!
Be a part of our exclusive sworn GUNNER24 Trader Community – now... I try to make you rich!
- with daily trades – quick, safe and profitable…
- in well-chosen precious metals, commodities, indexes, currencies and in the best stocks worldwide...
- in both rising and falling markets…
- with little use of capital…
Be prepared!
Eduard Altmann


