The FDAX bull market has been regulated for many years by easily identifiable magnets. This also helps us to work out the main goal of the current pullback cycle.
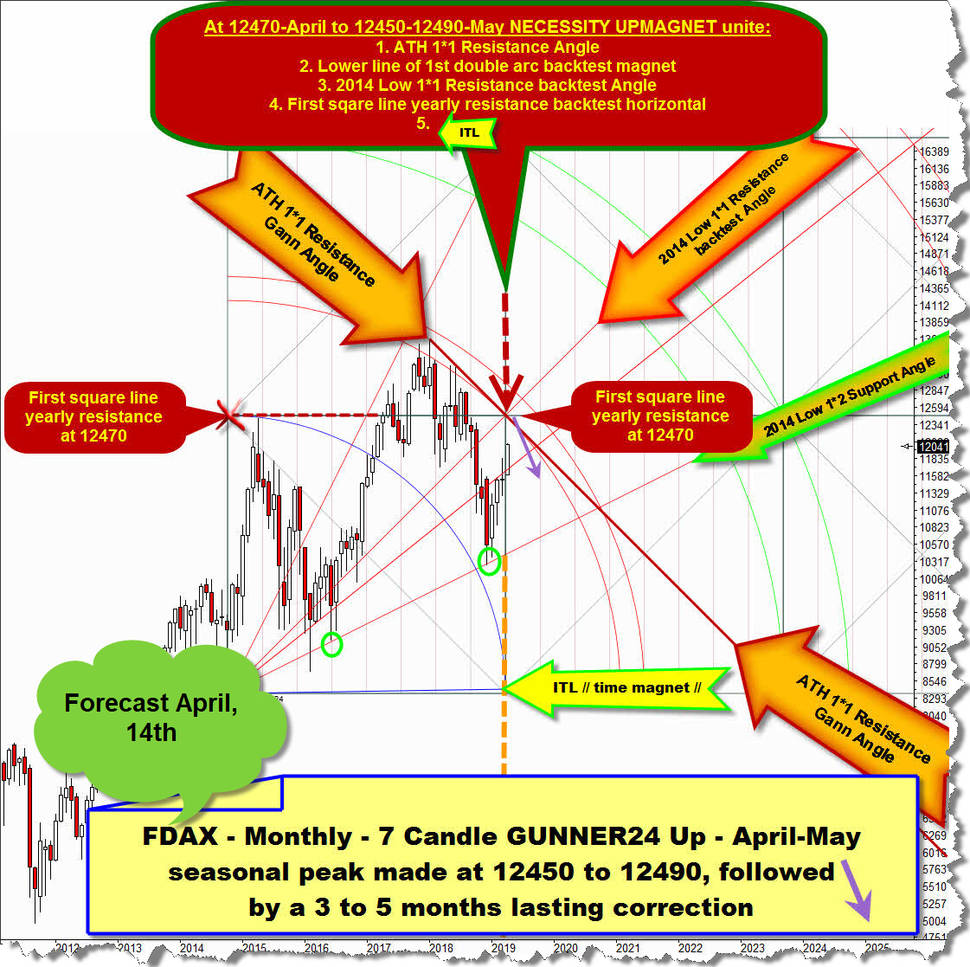
Within free "For the FDAX now 12450 pts are mandatory"-GUNNER24 Newsletter Forecast - click here to re-read this April view -, I stressed the FDAX, which is the DAX futures contract, compellingly should test 12470 pts at it`s April highs OR if this 5x resistance upmagnet will not be reached in course of April the price NECESSARILY has to work off major 12450 to 12490 upmagnet resistance area sometimes in course of month of May, before the anticipated spring-top process should begin.
After May 3rd price range for the very first time in 2019 reached 12450 to 12490 mega-strong resistance upmagnet area and EXACTLY executed our calculated 12470 pts fivefold GUNNER24 Resistance Upmagnet the anticipated pullback cycle actually was triggered.
Underway pullback started at the 12470 points-year-high is next week's in its 6th week, and then in the second month.
The first negative reaction, triggered by massive resistance magnet on yearly base, indicates that the FDAX again in 2019 seems to mirror it`s quite normal summertime treadmill:
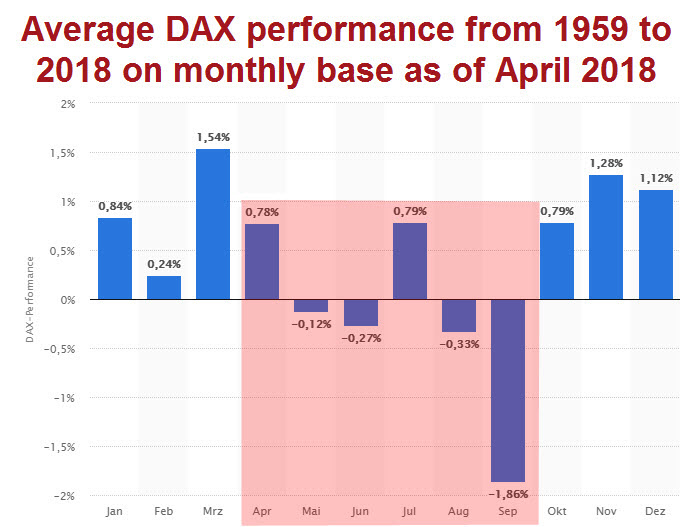
==> taking the seasonals into account FDAX all in all should pullback or correct for about 2 to 5 months candles (May to July or May to August). May is month No. 1, June will be second month of pullback!
Until President Trumps Mexico Tarrif`s tweet the pullback took place in a conspicuous range, dominated by 2 magnets on yearly base which are exactly "round" 400 index points apart.
Then on Friday, FDAX finally shifted to liquidation, because of this very special situation:
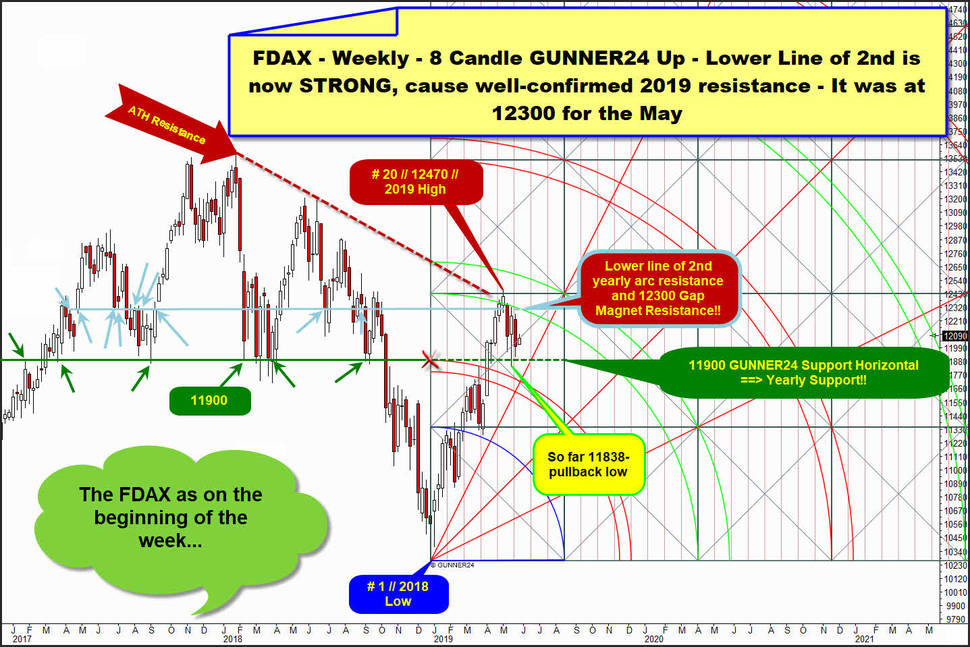
The 2019 rally topped after a 20-week cycle and exactly at 2nd double arc that became projected important GUNNER24 Uptarget/Upmagnet by the range of the first 8 rally weeks. = classic 8 Fib number weekly up, starting at # 1 // 2018 Low.
==> The 2019 Top is oriented to the 21 Fibonacci number. 21 Fib turn number or the time factor helped released the pullback. 2nd double arc is future yearly resistance environment. 2019 Top additionally arrived at now very confirmed = strong alltime-high resistance line or ATH Resistance...
Since the beginning of 2017 another rail in the yearly became very important. This is the above light-blue highlighted Gap Magnet horizontal, precisely running at 12300 pts. This Gap Magnet Horizontal added to major resistance area which kicked in at year high.
The rebound after 2nd double arc/12300 horizontal/falling ATH Resistance work off fired a sell candle, so weekly time frame turned to short quickly after # 20 // 12470 // 2019 High.
The 11838-pullback low that arrived early-May was inspired by the 11900 pts support horizontal that became important magnet at the beginning of 2017, which is mega-strong confirmed important rail – for this watch the green arrows at important 2017-2018 extremes – &&& that is in full sync to GUNNER24 Horizontal which evolves out of the upper line of 1st double arc line.
Means: 11900 was important magnet for the years 2017 and 2018 and also became important for 2019 and is directly connected to the waves or magnets of the 2019 rally cycle.
Or, 11900 is interesting price magnet on yearly base. Rails on yearly base are of course always natural strong supports, once confirmed as important in the past!
Until Friday the yearly 11900 was defended, but taking out this most important pullback magnet = yearly support magnet on weekly closing base opens the Trapdoor to this very important overall bull market support …
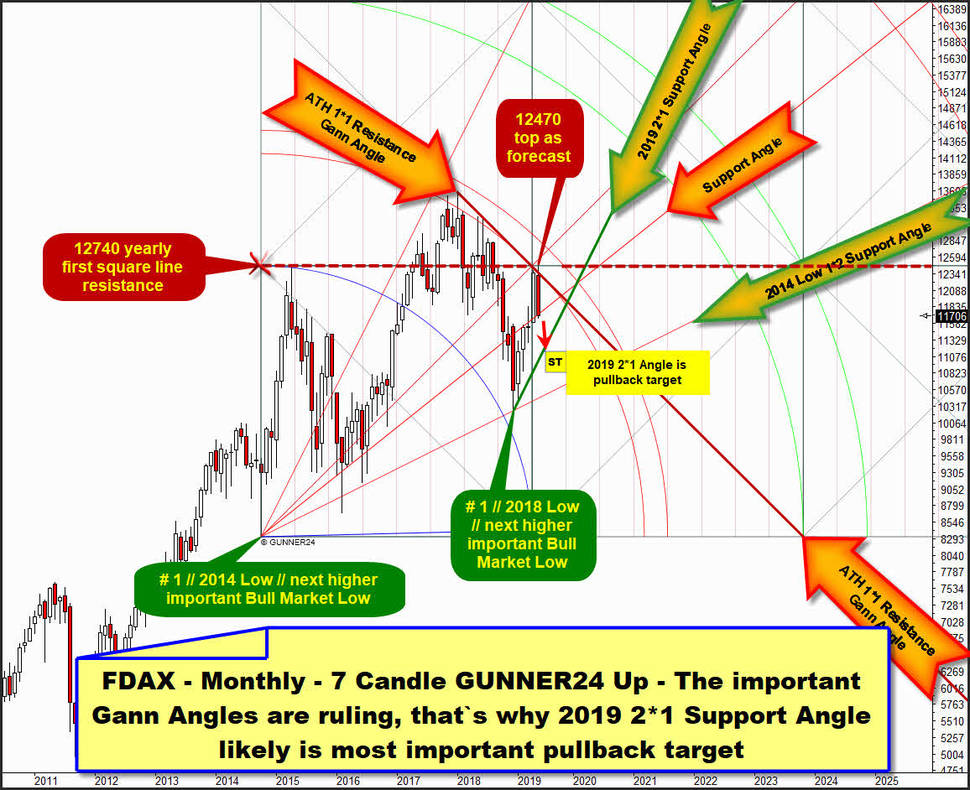
… to identify this most attractive pullback support or downmagnet, where we can expect the final turn or the FINAL SUMMER LOW`s, we switch back to the monthly chart and analyze the monthly 7 Candle GUNNER24 Up Setup, starting at # 1 // 2014 Low, already shown at the beginning of this issue:
As forecasted 12470 five-fold resistance upmagnet triggered the 2019 pullback cycle, whereby lower line of 1st double arc is now confirmed = strong downwards-sloping arc resistance on alltime-high base and on monthly closing base.
Additionally it caught all in all 7 month highs. Cause 2019 Top is lower extreme as 2018 Top and both extremes are caused by the same resistances (1. the lower line of 1st double arc and 2. ATH 1*1 Resistance Gann Angle ) could be the responsible thresholds for triggering a long-lasting, mulit-year long bear market ...
==> HOWEVER, the FDAX is in a very, very nice, safe, long-lasting bull market, so it's much more likely that the current high of the year - and therefore the 1st double arc resistance as ATH 1*1 Resistance Gann Angle - in the further course of this year will be finally and decisively overcome.
FDAX is in confirmed bull market - and this implies that future higher bull market highs are necessary – because the important higher bull market low of 2018 is directly connected to another important higher bull market low which is # 1 // 2014 Low.
These two higher bull market lows are naturally linked because 2018 Low EXACTLY has arrived at the green highlighted 2014 Low 1*2 Support Angle, that is natural strong Gann Angle support or ideal backtest target of bull market wave which started at # 1 // 2014 Low and secondly after 2018 Low another impulsive upwave on monthly base is seen.
==> After next higher 2018 bull market low a NEXT multi-year long bull market upcycle began at natural bull market support of 2014 Low 1*2 Support Angle!!!! Usually!!!!
And just because this first new bull market wave has come to an end for the time being at 2019 High after a 5-month candle advance at an obvious time/price resistance range, this next multi-year long bull market that began at 2018 Low is far from over!
He will only be corrected. Actually in the currently taking place summer 2019 pullback cycle! Which usual should last 2 to 5 month-candles according to the seasonals.
Whereby the pullback should test back important W.D. Gann Angle support existing in the annual chart. And again, likely to the T.
Because all of the important Gann Angles highlighted in the setup above have been acting exactly for the last few years or being respected to the utmost!
Namely the just discussed 2014 Low 1*2 Support Angle. But also the ATH 1*1 Resistance Gann Angle, which among others is responsible for printing current 2019 highs.
Target for the pullback cycle is the 2*1 Angle which springs directly at # 1 // 2018 Low, next higher bull market low and likely bearish extreme where the next multi-year long bull market upcycle is triggered.
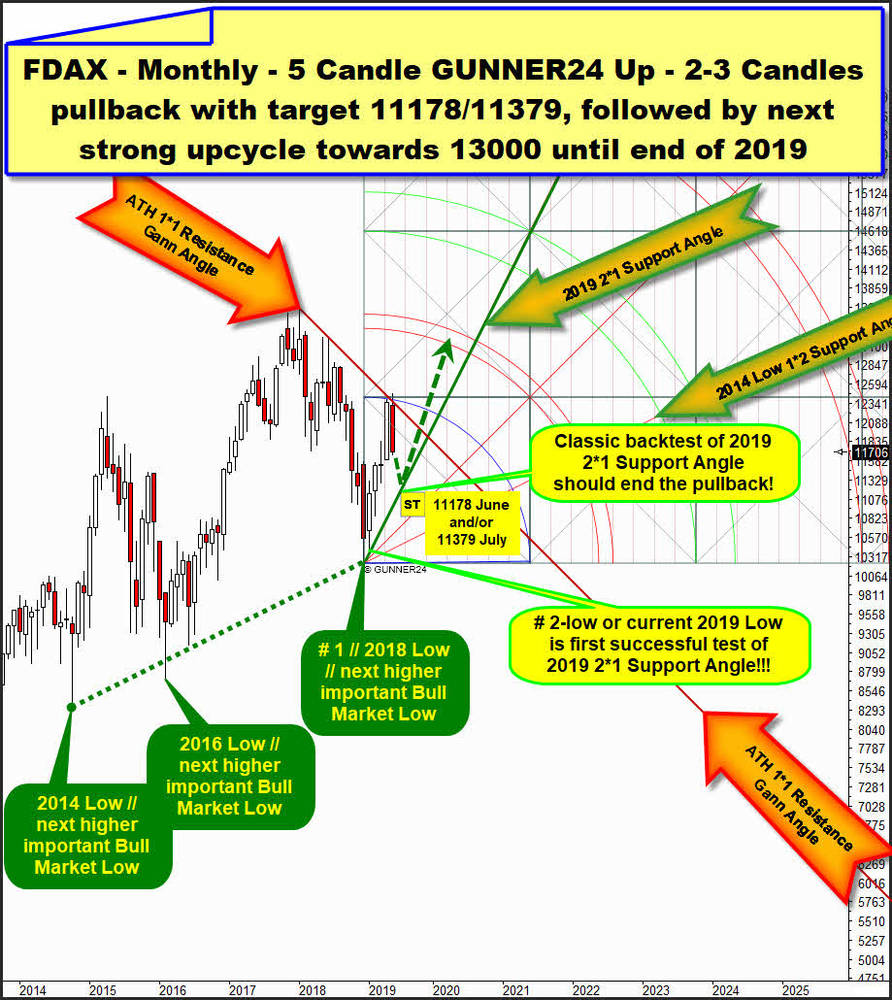
Please recognize above that after # 1 //2018 Low an impulsive wave began or a strong GUNNER24 Initial Impulse is seen which lasted 5 month candles and this is 5 Fib number. We observe indeed classic first upwave of a new baby bull, as it seems.
Watch that # 1 // 2018 Low is PERFECT second successful backtest of 2014 Low 1*2 Support Angle and after higher 2016 bull market low a next higher important bull market low is triggered by that 2014 Low 1*2 Support Angle. This makes 2014 Low 1*2 Support Angle as official bull market/bear market trigger line ...
… and just a very first future month close below 2014 Low 1*2 Support Angle is official GUNNER24 Signal that FDAX formerly has switched to a multi-year long bear market.
Upwaves will be corrected. And because the 5-month-candles running first wave is based on a Fib number, the pullback should also be based on a Fib number. Meaning for us is that the pullback should actually take 1, 2, 3 but also 5 month-candles.
Well, the June will be the second month of the pullback.
Please look very carefully now!
At noted # 2-low we observe the first successful backtest of 2*1 Support Angle out of # 1 // 2018 Low. Or # 2-low is the January 2019 Low, that at same time is current 2019 Low.
==> That`s why the 2*1 Support Angle out of # 1 // 2018 Low represents rising support on yearly base! And I expect just the next - just second! - classic backtest of 2019 2*1 Support Angle is now in the making.
And usually we should again anticipate a very accurate test of this likely most important rising yearly FDAX support because since years this market always respects important yearly W.D. Gann Angles accurately!
And well, after such perhaps next perfect test of 2019 2*1 Support Angle the 2019 pullback cycle should finally end either after a two-month or three-month pullback cycle, followed by upwave 3 in which FDAX is expected rally further into the Big Round 13000 resp. 13400 pts alltime-high resistance environment towards the end of 2019! At least!
For June 2019 candle, that will be second pullback month, the 2019 2*1 Support Angle runs at 11178 pts.
For July 2019 candle or possible third pullback month, 2019 2*1 Support Angle resides at 11379!
GUNNER24 pushes the heavy buy trigger at very first monthly close above ATH 1*1 Resistance Gann Angle!
Just a brief announcement: Over Pentecost I’ll take a couple of days off. Thus, the next issue of the free GUNNER24 Forecasts will come out again on 06/16/2019!
Enjoy and be prepared!
Eduard Altmann

