For some it's an uncharted territory - For the GUNNER24 Traders it is the money printing machine
Certainly, you sometimes remember the statements and comments of the analysts and chart technicians who in a roundabout way admit that they cant cope any more either with the chart-technical situation of a stock or the market or the emerging consequences of the all time highs when they are talking of an „uncharted territory".
In case of a strong upwards trend, for most traders the classical remedies of the technical analysis are not of use any more. MACD, RSI or Stochastic Oscillator may remain in the oversold area for a long time giving there some false signals. So the confidence in those indicators can dwindle rapidly. The signals offered by the Fibonacci Extensions and the pivots are too weak and not sufficient. Many traders are caught on the wrong foot then because they are surprised by new resistances and the newly emerging supports.
Gold is in the uncharted territory now. Let's get cracking having speak the GUNNER24 Forecasting Method for itself:
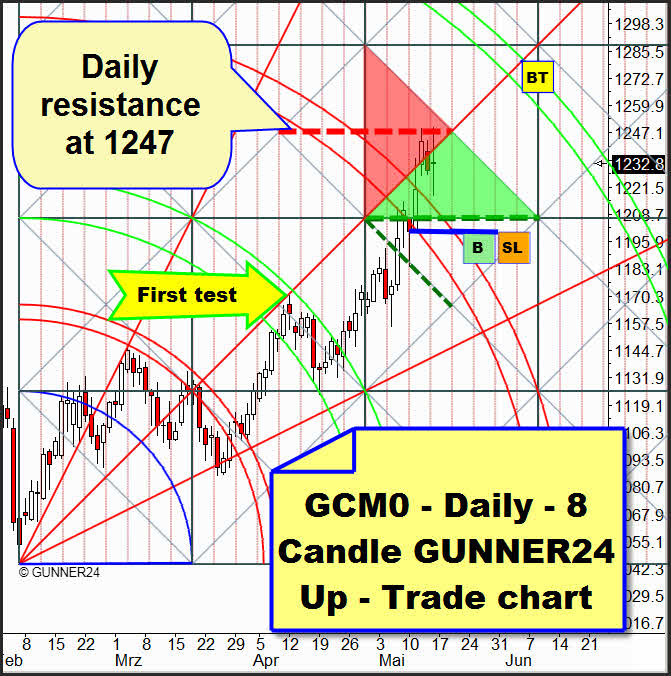
As to the well done long entry, released by the green dotted support diagonal: Last Monday, gold rebounded from it. As forecast, (GUNNER24 Forecasts, Issues 05/09/2010) gold reached the support diagonal thus producing a new buy signal. As forecast, in the course of the week the 3rd double arc was broken and as forecast, the price was stopped by the 1*1 Gann Angle. Two new all time highs were produced. Why doesn't gold rise higher?
Please pay attention to the red dotted resistance line at 1247 existing in the 8 Candle GUNNER24 Up Setup! Combined with the 1*1 Gann Angle arises a cross resistance that last week braked the gold. Therefore results that the left triangle of the just passed square is a resistance area. Since at 1247 only a relatively weak counter reaction to the all time high followed as a result the support area is arisen where the price is actually.
That means, day trading next week we will buy any dip at the double arcs on 4 and 1 hour basis or on 15 minute basis respectively because we know with a hundred percent security that after dips gold shall react violently into the trend direction again. Next week, gold can really retrace only until the end of the support area onto the green dotted support horizontal (1205-1207).
Further, the actual monthly 13 Candle GUNNER24 Up Setup shows us the following status quo:
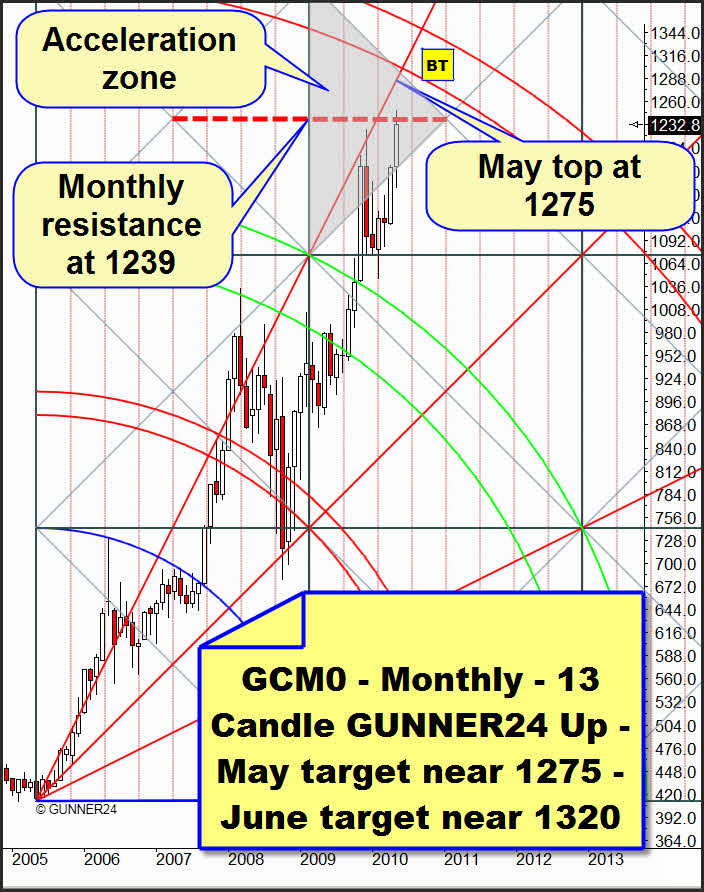
In this GUNNER24 Setup, too, gold has reached a striking horizontal resistance that proceeds at exactly 1239. That's why it was stopped.
The actual situation in the current weekly 8 Candle GUNNER24 Up Setup shows us another horizontal resistance line.
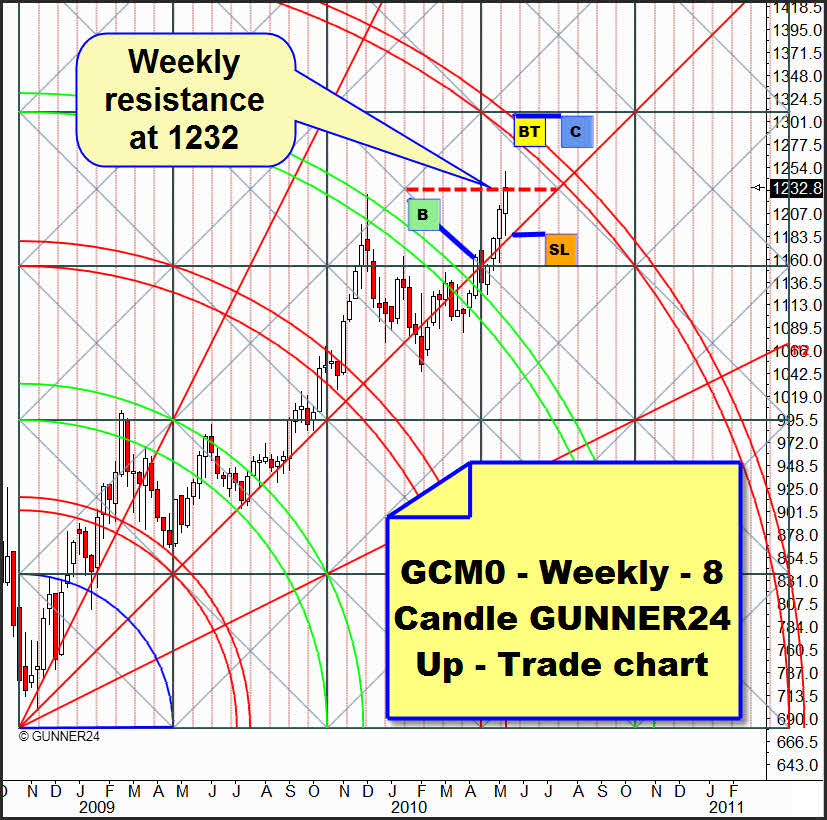
That one is proceeding at 1232. But it was exceeded at 1232.8 with the week closing! That was a first hint that we will have to reckon on more weekly highs next week.
Let's sum up briefly: Daily, weekly and monthly setups produce resistances at 1247, 1232 and 1239. The reactions of Wednesday and Friday do not show any violent counter reaction to the all time highs. All the setups show that gold has not reached its overriding targets yet. The daily setup puts out the important mark of 1205-1207 where gold should fall onto maximally, next week. Day trading we will buy any dip and wait for overcoming the broad resistance.
As on weekly basis we received the first light sign of a breakthrough the following daily 8 Candle Elliptical GUNNER24 Up Setup could produce the sign of escape:
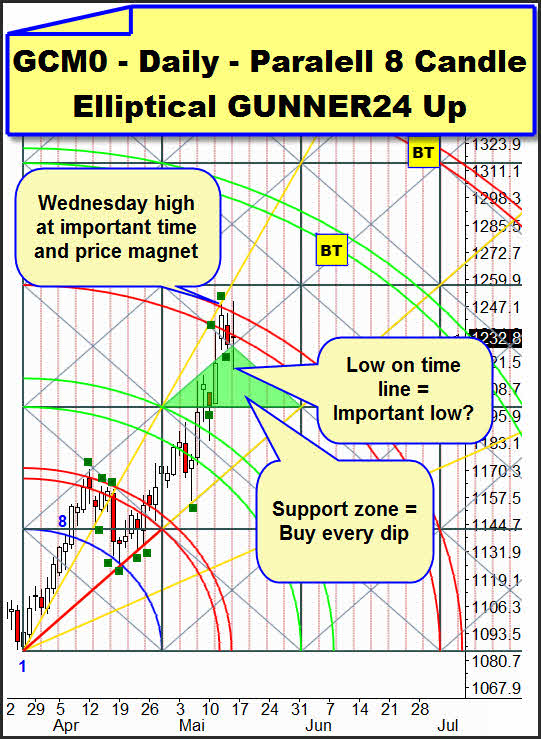
The situation: I put a little green square on all the important points where the price is correlating with the GUNNER24 Up Setup. That elliptical setup is very valid, you only have to get the blue arc to tally from candle 1-8 with the double test of the blue arc (the two lowest green squares). At the uppermost green square we recognize the coincidence of the price with a time magnet (Gann Angle) which on Wednesday produced the first all time high. That Gann Angle is limiting the possible escape from the 1232-1247 resistance area. On Wednesday, the price closed within the main target which is the 3rd double arc thus confirming the next target of 1275 as well. On the important time line, Friday produced either an important low or an important high. Again we recognize the green support zone. It seems to be very strong. That's why I think on Friday we produced an important low and on daily basis gold is on its way to another rise. On daily basis, we will be going long with further contracts if the 3rd double arc is broken upwards!
Also this setup signalizes that day trading you can make successfully use of any dip downwards with a short term long entry.
The big problem is that next week will be an expiration week. During the last years, in those weeks gold was always squeezed successfully. That is why for next week we have thought in the following considerations we will have to reckon on:
1. We will break out upwards on Monday or Tuesday: Then the breakout could follow very fast until our 1275. Then the target should be worked off until Wednesday or early Thursday, respectively. Then we will have to be prepared for a rapid decline through Friday next week or at least until Monday of the week after. Target for this down swing: 1240.
2. We will not get a breakout but just a false breakout, the resistance area will resist. The whole week will be squeezed, gold will not break the 3rd double arc in the upper daily 8 Candle Elliptical GUNNER24 Up Setup significantly but drift in its area of influence until Friday next week or Monday of the week after until the possible down target 1200-1208. Not before that the way upwards will go on... That scenario is very likely if the Friday low of 1217 is fallen on Monday or Tuesday.
3. The dumping will not take place. That would seem to be indicated by the price performance of last week… little counter reaction to the all time highs, the upwards trend is simply too strong... then gold should pretty leisurely rise in stair steps through the middle of June until the next main target of 1320.
Let's have a quick look on the stock markets.
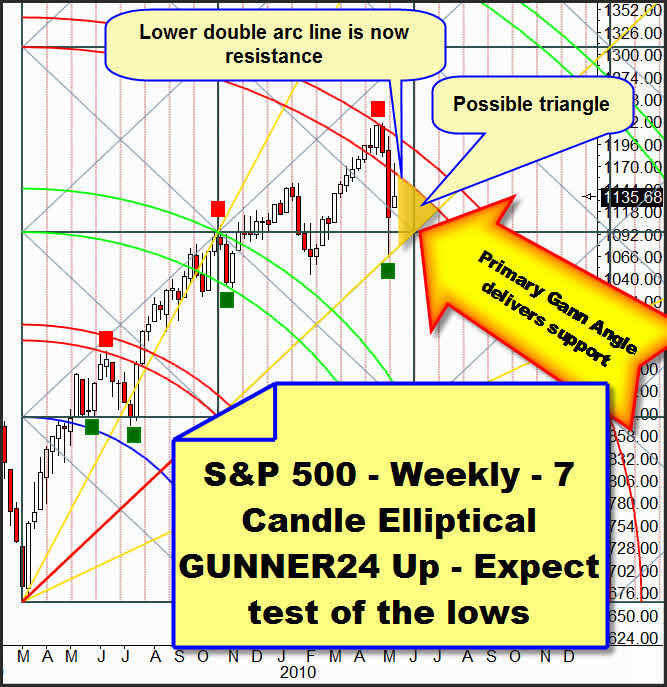
At the beginning of the week the markets recovered a little bit but since Thursday they are on their way to test the 05/06/2010 lows. Further we assume that those lows are extremely significant and they should resist. Correspondingly we are quite adjusted bullish, but we know that a test of those lows is necessary to confirm the long term upwards trend. Otherwise, we expect a several week sideways move given to understand by the upper 7 Candle GUNNER24 Up Setup. Last week the 3rd double arc was confirmed as to be a resistance. Since the price should be backed from below by the primary Gann Angle we might enter into a triangle.
In the final analysis, the FDAX shows, of course, the same performance. But...
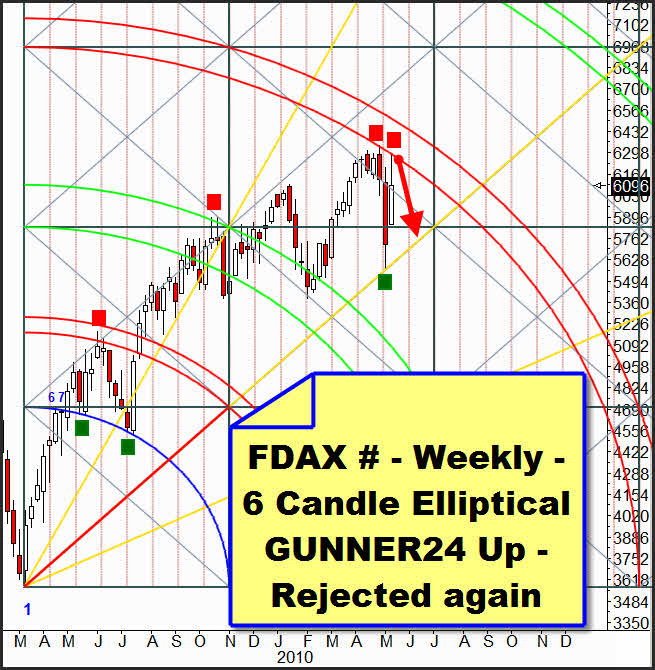
The counter reaction is to be read even more unmistakably in the 3rd double arc. Until now, the FDAX has NOT closed within the main target yet, at the very contrary to the US markets. Here, a triangle situation until July is offering itself. Here again is valid: Short on weekly basis not before we will have broken the primary Gann Angle.
Let us still have a look at a beautiful daily GUNNER24 Up Setup which is determining the actual down swing.
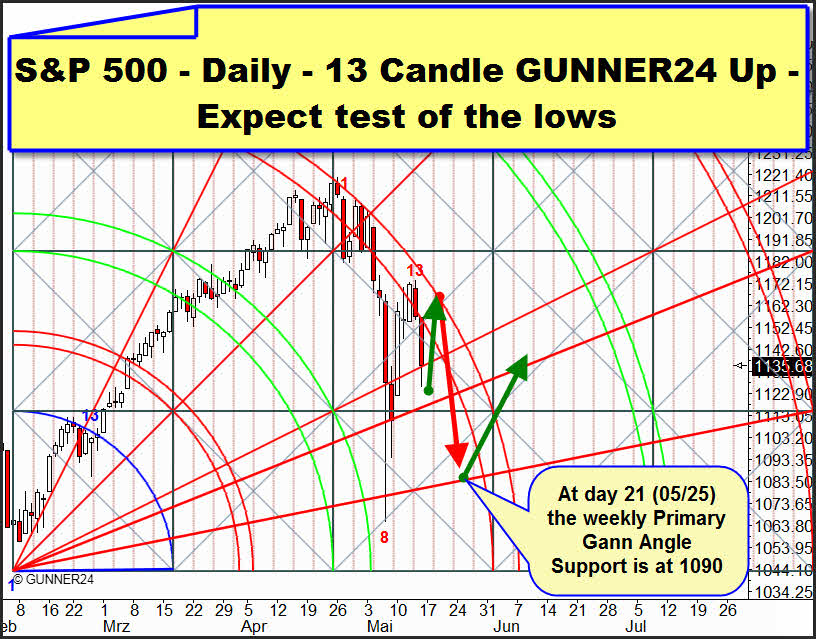
The down swing has been lasting for 14 days, so the 21st day we can expect the next significant low or high, respectively. On 05/25/2010 a perfect low would be at 1090 when a daily and a weekly price and time magnet will coincide. We recognize that the price is following the 3rd double arc. Most probably it should do so next week as well. On Friday, the 1*2 Gann Angle at first stopped the decline. That may offer us the possibility to head for the upper line of the 3rd double arc again. A significant! break of the outer line of the 3rd double arc combined with a reversal candle offers a promising long entry which you may check crosswise by the actual 5 Candle GUNNER24 Up Setup. That setup begins at the low of the candle red 8, and it ends 4 candles ahead. A 5 candle initial impulse.
Be prepared!
Eduard Altmann

