As if by magic, once again the intentions of the US stock markets lie before us like an open book. One piece of the puzzle after another fell into place after the Dow Jones Industrial Average and S&P 500 reached their next alltime-highs in May. The next important price- and time-targets have developed.
Let’s start reading the Dow Jones Industrial Average with the help of the Dow Jones E-mini continuous future contract (YM #). For my hard rally continuation call, I only use the YM # on the monthly chart, as well as the currently most important monthly GUNNER24 Up Setup whose signaling give some ideas where the most important zones are, we have to track for the coming weeks, to squeeze the best out of the now started melt-up cycle.
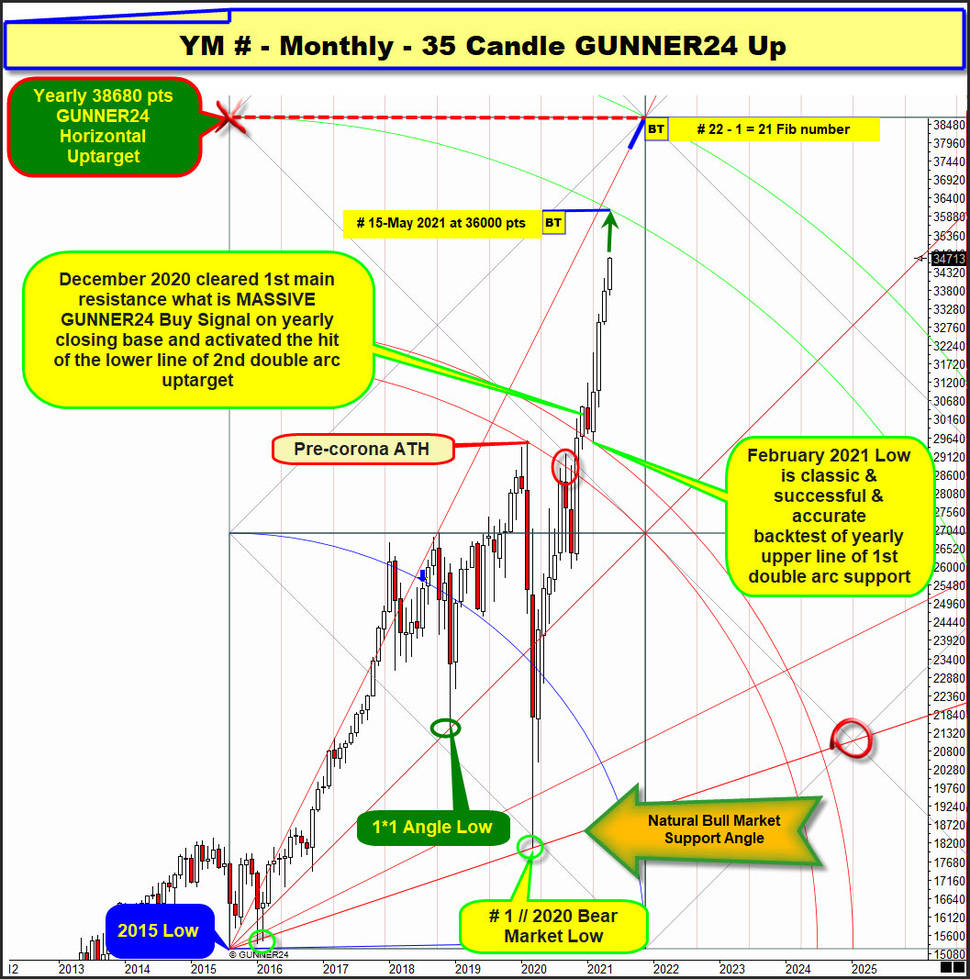
We place this 35 Candle monthly GUNNER24 Up Setup at the major-important final 2015 low...
The most important setup in the monthly time frame. Owing to the signals triggered by this setup, now it’s possible to make important and stable predictions concerning the further future course of the index! It measures the complete first up impulse from the important higher 2015 Bull Market Low. It is oriented to the high Fib number 34 as 35 - 1 = 34.
At 2018 Xmas low, the final low of 2018, the 1*1 Bull Market Angle was successfully defended to the T. This price/time event is highlighted with the dark-green support oval. # 1 // 2020 Bear Market Low has arrived at another important natural support out of 2015 Low what is the within setup naturally anchorable „Natural Bull Market Support Angle".
The rally starting at the final low of 2018 and at the 1*1 Bull Market Angle with a 100% accuracy was braked by lower line of 1st double arc uptarget which then radiating negative resistance energy lead to the shortests bear market ever. The rally starting at # 1 // 2020 Bear Market Low at red resistance oval again found stronger resistance energy at the alltime-high resistance rail of the lower line of 1st double arc.
This lower line of 1st double arc main resistance was determining strong and long main resistance because there first the February 2020 Pre-corona ATH has been printed. Its downward radiating resistance rail second ruled until October 2020. Starting with the Biden elect bull market continuation event the final November 2020 close was able to overcome this reigning ATH resistance for the very first time.
==> Then the year 2020 even closed above the entire 1st double arc resistance what fired a MASSIVE GUNNER24 Buy Signal on yearly base and activated the future hit of the lower line of 2nd double arc in (bull market) trend direction.
The entire 1st double arc space was a major resistance range because this double arc-threshold wasn`t allowed to be overcome finally for 1 full year! The final overcoming of the entire 1st double arc magnet was granted only after the February 2021 low with a 100% accuracy retested the the upper line of 1st successfully from above. And up she went again...
Think, at February 2021 lows a melt-up = buying panic cycle began to unfold. For some prove of this watch the big bull candles February to April 2021. We recognize only higher highs, higher monthly lows and higher monthly closings. Exceedingly bullish are the powerful and above-average gains of the February, March and April 2021 candles. The steepness & cleanliness of the rally that began at the Feb21 lows is truly outstanding. In addition, the new May candle (15th month candle of the bull market) seems to have found its final low again shortly after the beginning of the month. And so we now come to the time signal that was fired with the higher alltime-highs of May 2021.
The time factor of this bull run is signaling this:
==> Since the past # 14-April 2021, as well as the present month of May (# 15) were able to attain a higher high than the 13th month of the bull market and in addition # 15-May once again could reach higher alltime-highs, the Dow Jones - and, of course, all the other major US equity markets in tandem - should have to keep on booming strongly now till the next higher Fib number above the 13 Fib number of the running Fib number sequence will be allowed to facilitate the next important change in trend resp. the next important top.
The 35 Candle up chart above inter alia always generates prognoses on where important turns/extrema might be pending resp. allowed to be expected.
==> Since the bull run succeeded in overcoming visibly and clearly the very most important resistance, the resistance of the 1st double arc on monthly closing base at the 2020 close, the lower line of the 2nd double arc is now the next activated important uptarget for the YM # in the monthly time frame.
As extremely bullish as this # 15-May 2021 has started and because of this seasonality conspicuousness, this activated monthly GUNNER24 Uptarget of the lower line of 2nd double arc should be reached pretty much exactly at 36000 index points already in the course of May 2021.
==> # 15-May 2021 uptarget is the 36000 points: With more than a 85% of probability + certainty, the Dow Jones future will work off the lower line of the 2nd double arc either at 36000 surroundings in # 15-May or – at the latest – at 35980 index points in # 16-June.
The Dow Jones again runs like on rails in this Post-Election Year!!
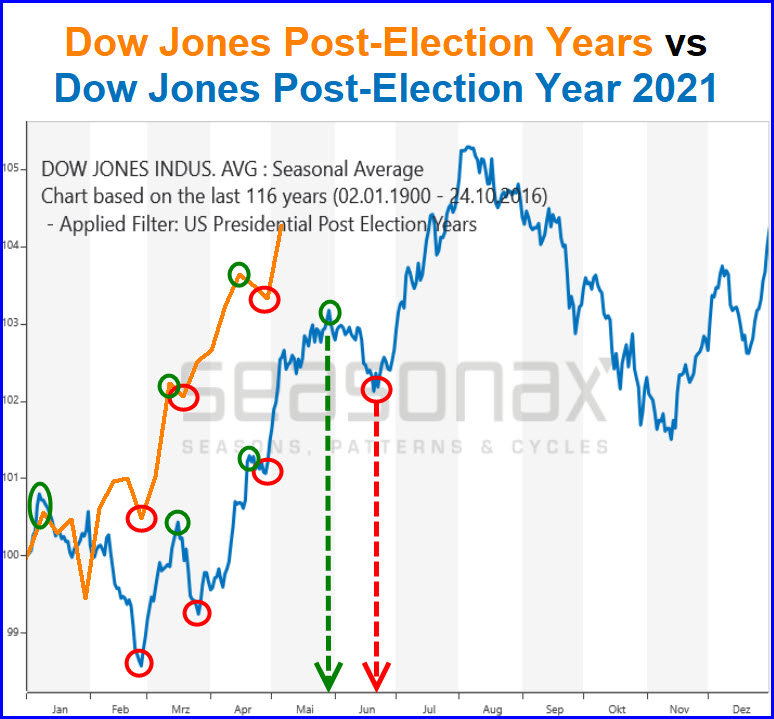
Since the beginning of the year, regarding important extrema and turns the US stock markets have been following the average post-election year course in the US presidential cycle in a noticeably significant way.

Source: https://www.seasonalcharts.com/zyklen_wahl_dowjones_postelection.html
The trading year 2021 so far is speaking a plain language. On the chart above, the blue line represents the average Dow Jones Industrial Average performance of a post-election year in the US Presidential Cycle from 1900 to 2016. And beyond any doubt this year 2021 orange-line course mirrors blue-lined 116y-seasonal pattern again closely regarding the most important swing highs (green ovals) and the most-important bullish turns (red ovals) in 2021 up today.
Typically the May is a full-pull bull month with month lows made early and month highs made last. The GUNNER24 Signal State is in line with 116y-seasonals and this is why at 36000 pts bull market uptarget the likely post-election year late-May turn date should fire a next intermediate rally high which should then be corrected/digested for about 4 to 6 weeks before the melt-up-rally is expected to continue MASSIVELY for a few more higher alltime-highs and possibly a very decisive bull market high on yearly base, what is predicted in terms of 116y-seasonality for the end of # 17-July to early # 18-August time window...
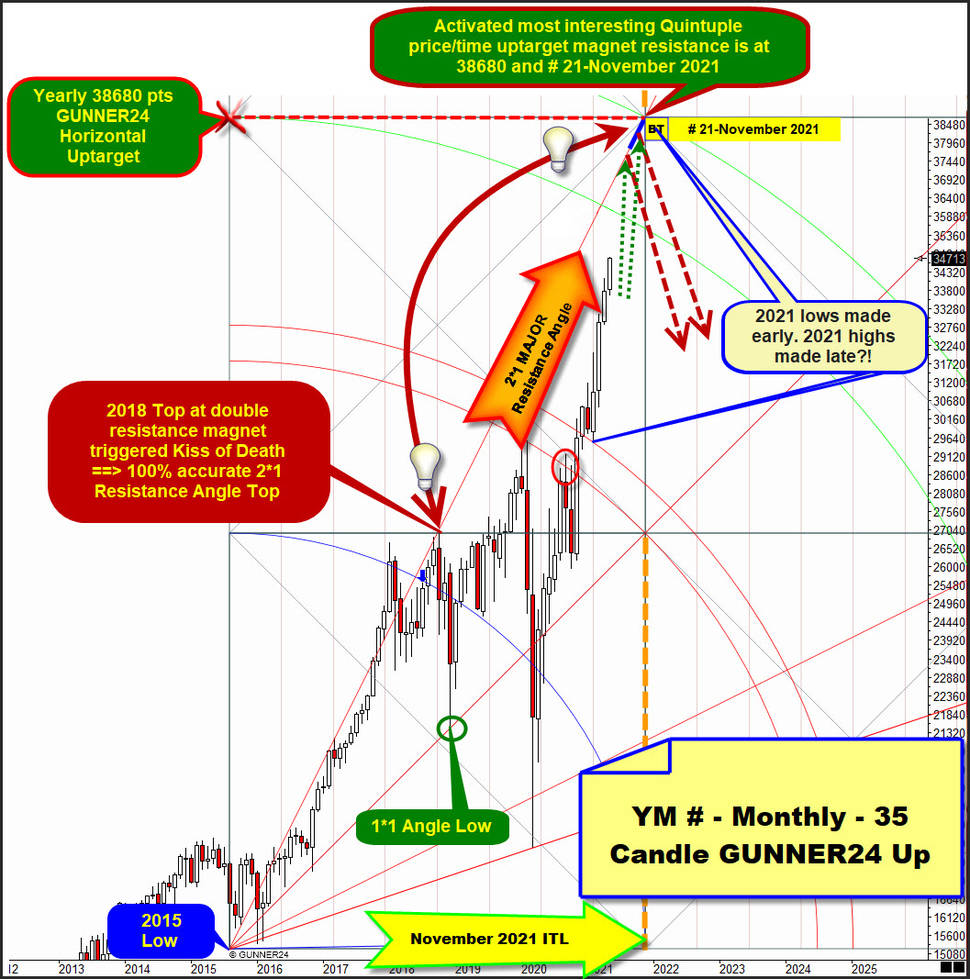
Now, have a look again at the same setup as above, just with sharper focus where and when the final bullish exhaustion of this powerful rally might occur based on the present GUNNER24 Magnets:
Obviously the most attractive future magnet regarding time is the # 21-Fib number November 2021 what is in full harmony with the next due orange-dotted vertical we name GUNNER24 Time Line = ITL. This is a double time magnet, which may force the market into final bull market highs in terms of timing.
For this month, 3 additional price components combined in 1 price. = BIG FUTURE PRICE MAGNET: 1. the upper line of 2nd double arc, a possible very important next bull market uptarget which will be finally activated with the very first month close above the lower line of 2nd. 2. the 38680 horizontal what originates from the highest price point of the lower line of 2nd double arc (what is activated monthly G24 Uptarget!) and thirdly, yes thirdly the 2*1 Major Resistance Angle which I have specially highlighted above. For good reason, I think...
This 2*1 Major Resistance Angle was to the T negative tested resistance on yearly base at final high of 2018. This last negative test of the 2*1 Major Resistance Angle from below at 2018 Top lead to a nearly -20% correction into the final lows of 2018, made at 1*1 Angle support.
Since this 2*1 Major Resistance Angle once was the most important and strongest possible resistance in the past what triggered the second strongest correction since 2009 lows it is plausible that the next test of this rising yearly resistance angle or rising yearly resistance upmagnet can again finalyze important bull market highs. Possible final bull market rally highs possibly cemented during # 17-July to # 18-August 2021 time window, set due to the 116-y post-election year seasonality.
==> The now activated most interesting, means possibly the most influencing price/time factor regarding final bull market highs is the fivefold price/time uptarget magnet resistance at 38680 pts for # 21-November 2021.
==> Alternatively, and perhaps earlier than November, the next accurate test of the 2*1 Major Resistance Angle (= unusual heavy upside magnet on an annual base and for this 2020-2021 bull market cycle), may force the Dow Jones into its final annual highs.
==> With a +85% safety the Dow Jones E-mini continuous future contract (YM #) will trade at 36000 to 35980 index points til end of June 2021.
Be prepared!
Eduard Altmann


