For more than a year, I haven’t yet subjected platinum to an intense trend analysis. The last couple of weeks, the number of emails increased that our office received regarding both the targets of the current uptrend and useful entry possibilities.
I’m fond of seizing these suggestions today even though - beside the Gold-and-silver Mining Stocks – platinum is the one to emit/put out the most confirmed clues on the proper moment when the current countertrend in the precious-metal complex is supposed to end.
In addition, platinum is the only market in the precious-metal environment so far that is giving very concrete indications – provided I can assess it with the aid of the GUNNER24 Systematics – when should be the beginning of the yearned-for first strong correction move in the precious-metal sector whose end would offer again the best cause riskless long-entries into the current countertrend.
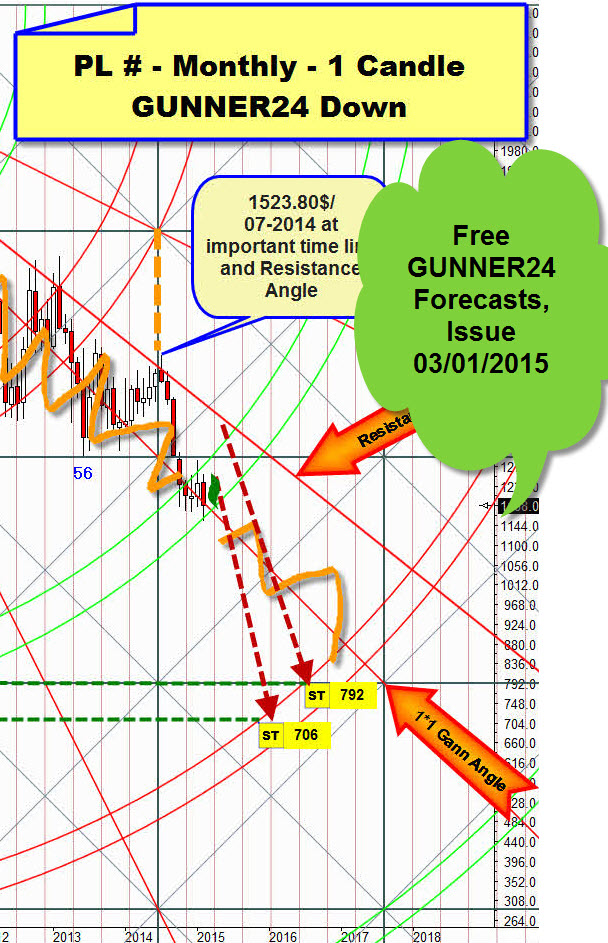
Obvious targets for the bear market were 792$, the main target 748$, resp. 706$ depending on the further development during the year… The final bear low was to be reached and processed till March 2016 at the latest. So, platinum was to reach resp. work off more or less the 2008-bear market low environment… then the bear market beginning in March 2008 at 2308.80$ was expected to be able/forced to extend to its 89th month = March 2016.
Since as early as at that moment of the analysis regarding chart structure, platinum was the absolutely weakest member in the family of the four important precious metals being active some severe sell signals, there was even a chance beyond theory for the metal to be forced to sell off to 490$ in a panic move till March 2016.
Then, ultimately platinum finished its bear market on 01/21/2016 at 811.40$. Thereby it was the last of the four important precious metals to bottom (gold bottom: 12/03/2015, silver bottom: 12/14/2015, palladium bottom: 01/12/2016).
==> This means that also concerning bottoming it was the weakest of the four precious metals according to time.
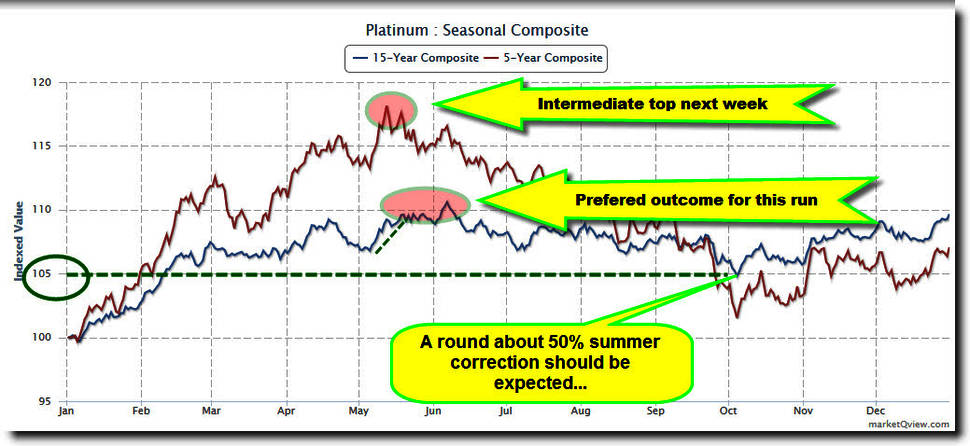
Since then, resp. in 2016 it has been following its customary seasonal patterns so far:

Source: www.marketqview.com/seasonalchart.php
To be precise: Actually, rather exactly it is following the average course of the last 15 years in 2016. Just read the daily chart beside it. The important swing lows and highs in 2016 meet the 15-year pattern almost exactly.
Well, how is that to be interpreted: Platinum hasn’t surprised at all since its January bottom. It is just following its completely normal 15-year seasonal pattern now.
==> Thereby, we’ve got a first important indication for the moment when this first up leg in the countertrend is supposed to top out. It’s either next week – following the 5-year pattern or the intermediate top for this first up leg should be reached in the first week of June +/- 3-4 trading days. The latter would be the absolutely preferred scenario, also preferred by the GUNNER24 Methodology. More about this will follow below.
The 15-year pattern also gives a first concrete indication for how long the subsequent summer correction might resp. would have to go: ==> 3 to 3.5 months.
==> From the perspective of the price factor it should be matter of a 50% correction move, at most.
Let’s immerse ourselves gradually in the GUNNER24 Projection for this countertrend.
Yet, here’s still a little comparison for the beginning. It serves for better comprehension backing my allegation why platinum… and therewith probably also the rest of the precious-metal realm --- are supposed to be moving "only" in an extended countertrend:
Performance so far in 2016 – I just leave out the Mining Stocks that were historically badly oversold at the end of the bear market, so they simply don’t fit in the following consideration:
Silver in US$: +26.14%
Platinum in US$: +23.99%
Gold in US$: +21.48%
Palladium in US$: +11.64%
Hence, platinum has been performing scarcely better than gold in 2016! Being barely behind silver, actually pretty terrific resp. bullish, but let’s compare these figures with the…
... Performance in 2015. For brushing up: With the highs made early in the year and the yearly lows made close to year end, 2015 was a glassy downtrend year:
Gold in US$: -10.47%
Silver in US$: -11.51%
Platinum in US$: -26.15%
Palladium in US$: -29.61%
==> Let’s realize that platinum nor in 2016 is able to outperform gold and silver. If it were in a bull market, technically it should have to however in order to even resp. catch up the multiply worse performance in 2015 compared with gold and silver. Comparing palladium the same way we realize that palladium is doing and performing subterraneously weak.
==> Conclusion: Platinum and in an even much more extreme way palladium haven’t really been going along upwards in 2016. However, to be able to state a bull market in the precious-metal realm, all the sectors would have to go along. The previously weaker ones have to outperform… just as the Gold and Silver Miners are showing by the way…
==> Another fact clearly indicating that platinum/palladium can only be in a countertrend in the monthly time frame:
Gold and silver are currently testing the high environment of the year 2015. Especially gold is likely to finally remove this important resistance in the yearly time frame (2015 high is at 1307.80$) during the next couple of days/weeks.
Gold close on Friday was 1289.70$, its uptrend high is now at 1306$. If this succeeds, gold will have to reach/work off the high environment of the year 2014 (2014 high is at 1392.60$) within its countertrend still in 2016!! However platinum that closed at 1082.60$ on Friday, will have to go up by nearly +20% again from the current level to reach the final high of the year 2015 resistance magnet = platinum year high 2015 is 1290.30$!!!
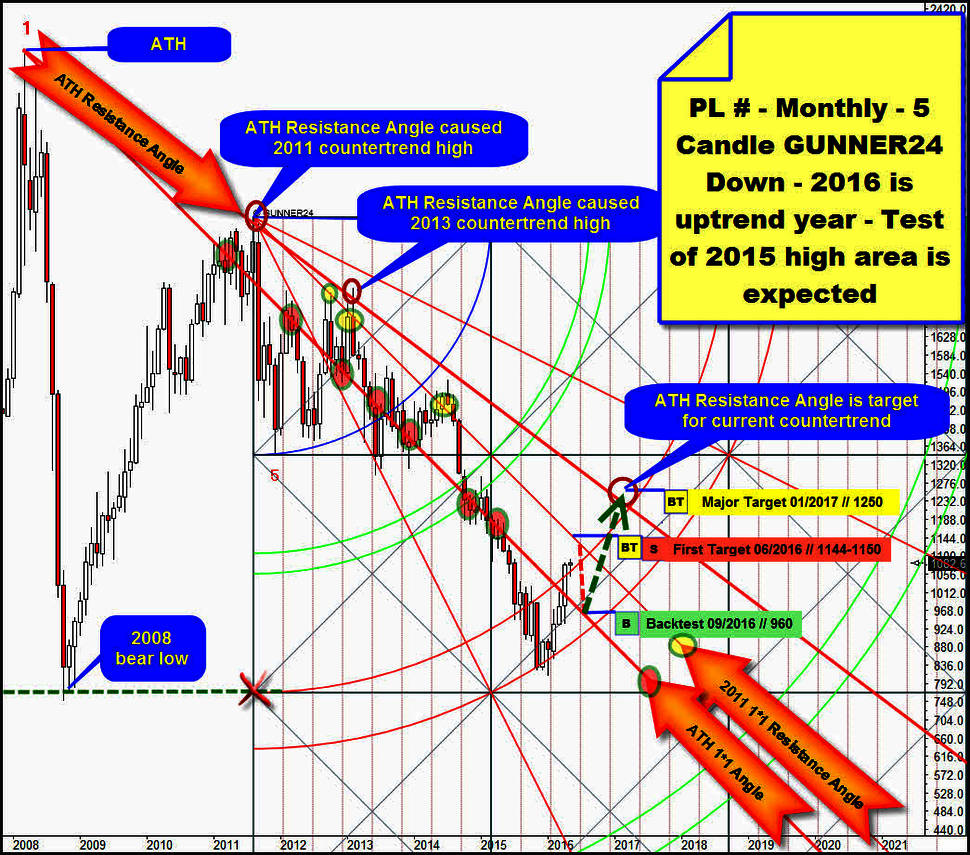
==> Platinum was, is and probable keeps being weak compared with silver and gold. The GUNNER24 Method is forecasting the high of this countertrend at 1250$, maybe 1270$. The countertrend is supposed to end rather exactly there after running about one year (12/13 months of countertrend) without removing the 2015 high:
Above you see a 5 Candle down of the platinum continuous contract in the monthly time frame. Starting point of the down setup is the important countertrend high of the year 2011 = final 2011 high.
For many years already, the metal has been orienting itself predominantly by 3 Gann Angles. These are starting point = magnets = targets for monthly up-and-down swings. These 3 angles have triggered important turns and signals on monthly closing base, beginning with the year 2011.
Firstly, it’s the ATH 1*1 Angle – important action at the ATH 1*1 Angle is marked with the green/red ovals.
Besides, there’s still the very most important and very strongest resistance resp. starting point for the price in the decade, yearly and monthly time frames: The ATH Resistance Angle. This resistance was responsible for several important countertrend highs in the bear market. At the corresponding final year high 2011 + 2013, the metal turns down again there.
The ATH Resistance Angle is newly activated uptarget now, the major uptarget of the current countertrend. The ATH Resistance Angle should have to be reached between December 2016 and February 2017 around the 1250$. Since there was a dent at the 2013 countertrend high, we can thoroughly expect 1270$ for the countertrend. ==> Major Target till 01/2017 is 1250$!!
The next higher resistance angle in reach is the 1*1 Angle that springs directly from the countertrend high of the year 2011. In the chart above, I named it "2011 1*1 Resistance Angle". Important action at the 2011 1*1 Resistance Angle is marked with the green/yellow ovals.
The 2011 1*1 Resistance Angle is the main resistance from which platinum is supposed to start a 3 to 3.5 month 50% correction of the first up-leg – probably in the first June trading week:
==> Platinum found its current bear market low at the lower line of the 2nd double arc. Glancing at it closely you’ll realize that the lower line of the 2nd double arc support was violated. We even recognize a minimum monthly close below the lower line of the 2nd double arc!! November 2015 closed scarcely below the lower line of the 2nd. This violation of an important yearly support suggests that the 2nd double arc support is stricken, not completely intact, so in succession it will break downwards thereby starting a new important bear market downleg that should have to work off the 3rd double arc support = at 650$ or so till mid-2018…
Back to present now. It’s obvious that the support of the lower line of the 2nd generated upwards energies. The month of April 2016 closed clearly above the upper line of the 2nd. Since the upper line of the 2nd is natural resistance… the way the lower line of the 2nd is natural support, with the April close another monthly buy signal was triggered. Thereby, the next higher important resistance is activated as next target. It’s the 2011 1*1 Resistance Angle! For May 2016, the 2011 1*1 Resistance Angle takes its course at 1150$ and for June 2016 at 1144$.
Since, owing to the most likely further seasonality course, the change is rather due in June than in May, the first target of this countertrend is the 1144$.
That’s where platinum is supposed to correct from, videlicet probably till September 2016. It will likely have to test back the ATH 1*1 Angle during the summer correction. The backtest of the ATH 1*1 Angle is supposed to proceed successfully. That’s where I currently see the best cause riskless entry into a long-position at 960$.
From the ATH 1*1 Angle, a very strong rebound should have to ensue then leading straightway up into the 1250$ Major Target! That’s where after altogether 12 to 13 months an ABC-wave structured countertrend is supposed to be over then starting the next powerful downleg in the overall bear market.
Be prepared!
Eduard Altmann


