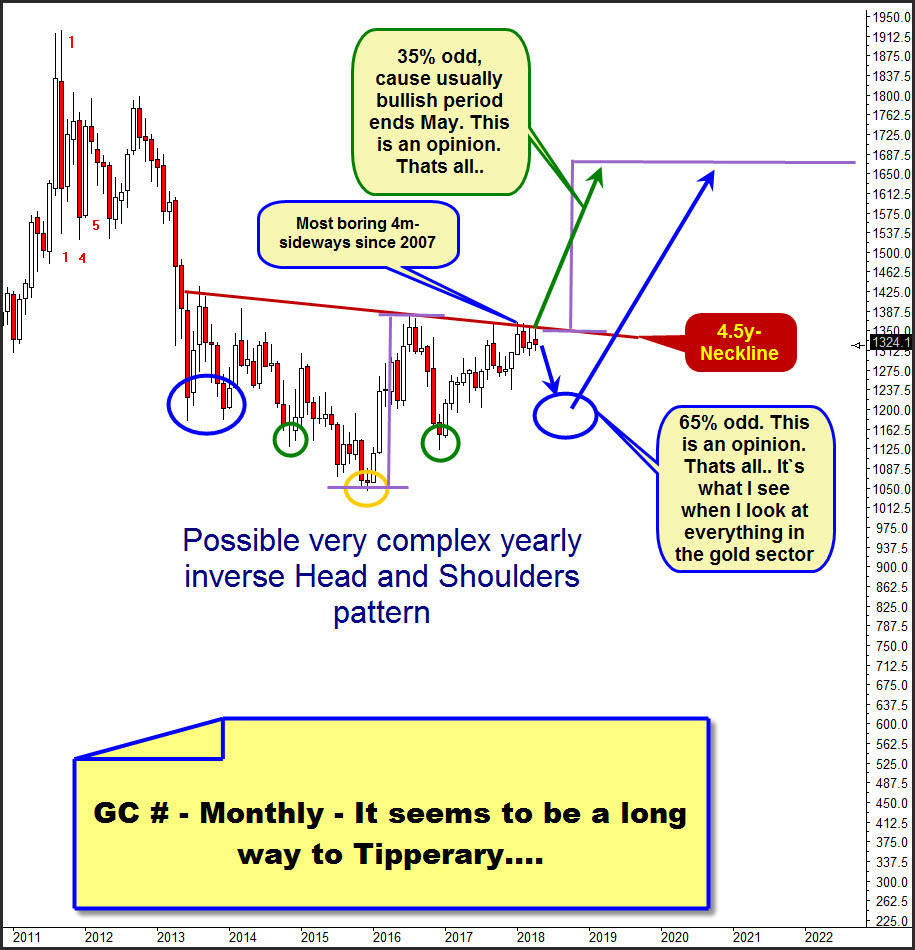
Gold along with whole precious metals universe is sideways since months. Playing field for intraday guys and risky swing traders in the daily time frame. These swings are very short, not sustainable, do miss regular natural price targets. Its a mess! We`ve been waiting inside the right shoulder in the monthly forever it feels like. I looked it up. Lastly, the yellow metal was just so unsatisfactory sideways in a narrow range more than 10 years ago.
Above is the gold future in the monthly scale since late 2010 and it looks like or smells like forming a very complex yearly inverse Head and Shoulders pattern. Initially a very bullish bottoming formation. But until the for now 4.5 years holding Neckline breaks up can still pass a whole full year! This is an option and an opinion I give a 65% possibility - IF the gold indeed works on a complex inverse Head and Shoulders formation on yearly base...
Somehow I cannot believe that it succeeds in overcoming this very stubborn neckline within the next few months... Simply because the first bullish time period of the year is now over starting with May and usually bearish summer doldrums starting soon.
But at least this long lasting complex bottoming pattern offers a nice technical uptarget which is at about 1660!
Gold could head south soon to work on the last right shoulder at the end of ssmmer/end of summer doldrums. Then we could welcome the 1250-1150 territory in the summer again. What a crap ...
Well, cause the trading Range of the last 3 candles and the current April candle is Narrow, the monthly chart is now in breakout mode. The gold formed an NR4 breakout pattern in the monthly scale! Year 2018 has formed a NR4 breakout pattern!
==> Thus, a completed trend change - from sideways no matter to up or down - should be a quite violent one and therefore tradable!
By the way. Back to the trading year 2007, then even a NR7 breakout setup (February to August) in the monthly was formed which then as soon as the 8th month was reached resolved bullish to the upside. After the bullish NR7 breakout gold managed to rally almost 400$ within the next 7 months!
The 2018 inactivity is best visualized with the help of the weekly chart:
Since the very first 2018 trading day the gold is caught sideways between 1369 and 1304. Very first 2018 trading day low is at 1304.60. This bearish first trading low extreme seems to have fired and important market that exists in the annual time frame cause this price marks lower end of the 2018 = NR4 sideways range.
2018 first trading day low was tested back and slightly undercut at March 1st low which came in at 1303.60. March 1st low is current 2018 low.
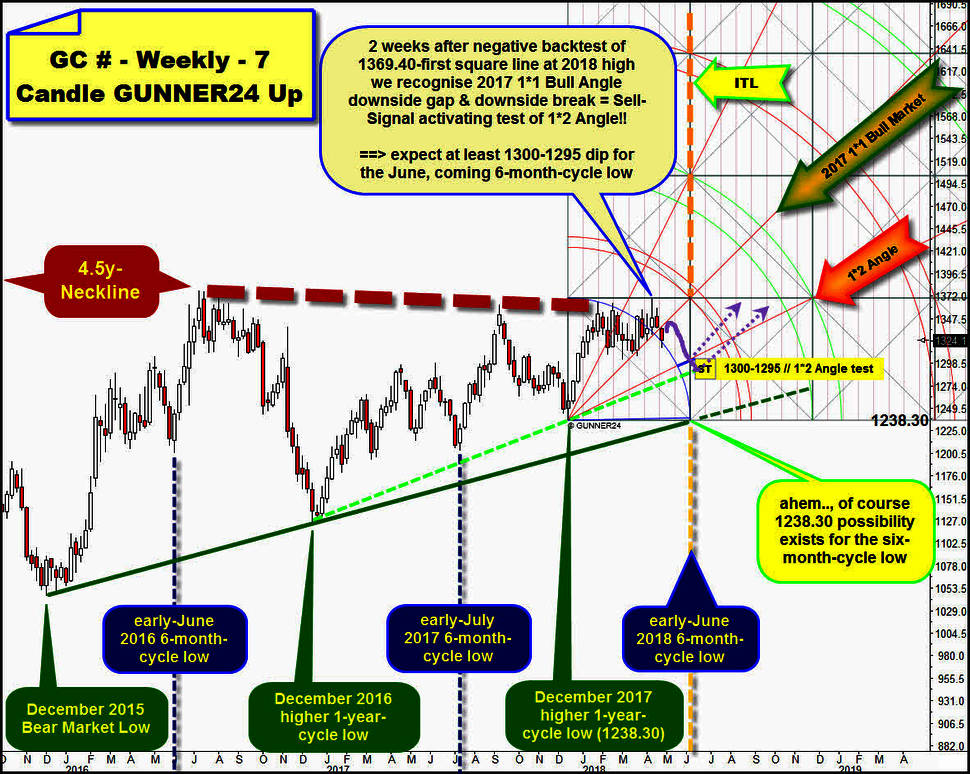
The 4.5y-Neckline is a 4 times negative tested resistance in course of 2018. Once at 1365.40-January high. Once at 1364.40-February high. Once at 1356.80-March high. The last test of the falling 4.5y resistance took place at the absolute year high. This was marked on 11th of April at 1369.40!
==> And now the weekly 7 candle GUNNER24 Up Setup which starts measuring upwards at next higher 1-year December 2017 cycle low is playing a part in the game!
==> 2018 high, made 2 week candles ago, additionally precisely has tested natural 1369.40-first square line resistance out of higher 1-year December 2017 cycle low, thus 2018 high tested existing a double resistance magnet formed by 1369.40-first square line and 4.5y-Neckline. And this negative test of described resistance magnet existing in the yearly time frame has probably triggered some bear forces!
Proof:
First this week at open gapped below 2017 1*1 Bull Market Angle out of higher December 2017 1-year-cycle low!
Secondly the week closed WELL enough below 2017 1*1 Bull Market Angle to release a trustworthy sell-signal on weekly base although the BIG 1322 SUPPORT and the weekly Blue Arc support were defended one more time on weekly closing base!
A decisive close below always most important bull market threshold within a GUNNER24 Up Setup is always a serious bear thing cause this activates the future test of next important Gann Angle below the 1*1 which is always the 1*2 Angle.
==> Weekly important Gann Angle sell-signal! Gold closed below nearest strongest 2018 support in the weekly. Together with the cyclical pattern, which has its next 6-month low in early June in front that makes the quick test down to the 1*2 Angle and another test of the 2018 sideways support very likely!
GUNNER24 Method points to the next test of the at 1304 running year 2018 support horizontal until early-June 2018.
Cause fresh activated 1*2 Angle downtarget resides a bit lower than the 1304 for late-May/early-June time signal which is the next GUNNER24 ITL (important time line) in front the awaited early-June 2018 6-month-cycle low could even bring another lower 2018 low at 1300-1295!!!
And once the rising light-green dashed yearly support at round about 1282-1285 is fallen short till early-June 2018, gold could even test back the 1238.30 in course of the summer doldrums because it is a very special conspicouousness that the coming important time line, the reached December 2017 low price and the rising strongest yearly bull market rail out of December 2015 Bear Market Low met at round about 1238.30 for the very first trading week of June 2018. Currently it seems totally unrealistic that the December 2017 low at 1238.30 could be tested at awaited June 2018 6-month-cycle lows but monthly time frame has an unusually rare Narrow Range (NR4) breakout setup!
You best register with our GUNNER24 Gold Trader now. That’s where we oversee the optimal entries and exits for you. Especially in the difficult market situations where many factors have to be considered the Gold Trader is backed by the additional GUNNER24 Signals based on the combined 1, 4 and 8 hour setups to catch the optimum entries and exits.
The GUNNER24 Gold Trader will provide you with the critical knowledge you need to forecast and analyse the precious metals with the GUNNER24 Forecasting Method. All the GUNNER24 Trading Signals you receive real-time are based on the actual Gold and Silver Future. The NEW GUNNER24 Gold Trader is a must for every actively working investor and trader who wants to trade successfully in everyday trading. The insights you receive from the head trader Eduard Altmann (and discoverer of the GUNNER24 Forecasting Method) are truly amazing sometimes. I promise!
Click the button below and order the GUNNER24 Gold Trader - $39.90 US a month. For 201 members and up - $49.90 US a month.
Be prepared!
Eduard Altmann


