The Senior Gold Stocks are breaking out with the GDX ETF extending higher into 7 year highs. Especially the institutional investors are pulling up now those seniors that are strongest in trend and fundamentally most promising. At the moment a horizontal resistance valid in the DECADE time frame is passed upwards.
==> Go fully GDX ETF long now. It’s a no-brainer, so all in!! The expected uptargets (in the short + medium terms) for the scarcely resumed rally move are to be found in today’s issue.
The Gold Stock breakout point was triggered Wednesday with GDX Gold Miners ETF trading at 32.50$:
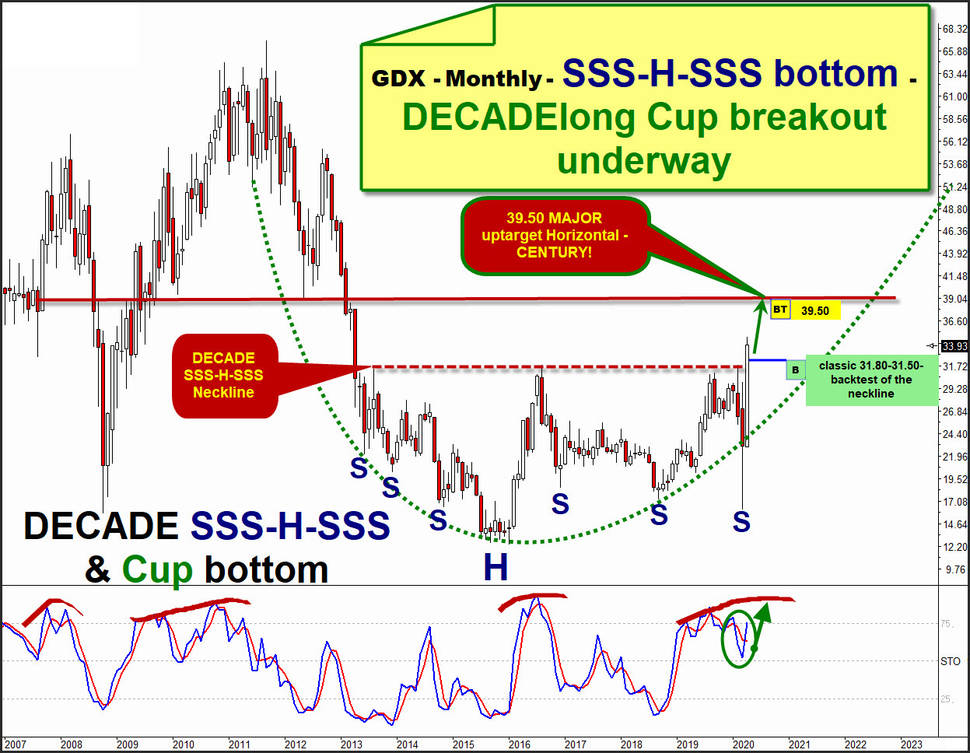
Within Trade of the Day 02/26/2020- click..., we analyzed that green-dotted DECADElong Cup together with developing complex DECADElong SS-H-SS bottom is unusual mighty bottoming pattern what at some day should lead to the overcoming of the Neckline of a combined Cup and SS-H-SS formation.
After the March sell-off and there and then triggered year lows the GDX started to look even more bullish as a very-complex DECADElong SSS-H-SSS bottom became visible. The Cup is still DECADElong defended support on monthly closing and opening base...
The neckline long point was triggered Wednesday and we`ve got stopped in at 32.50$ fresh year high for the 39.50$ major uptarget, the next nearest higher MAJOR important rail what is another horizontal rail resp. a so called "pivot" on CENTURY base.
On Friday, the GDX closed at 33.93$, thus decisively far above the SSS-H-SSS neckline after printing new year highs and a new +7 years high. Therewith, the DECADElong SSS-H-SSS neckline resistance is clearly overcome on weekly closing base!
And together with the monthly GDX Slow Stokes in steep rise and in full bull mode nothing really important should disrupt the underway GDX breakout towards 39.50$ main target cause now one of the strongest possible buy signals is triggered, namely a one on DECADE base.
Gentleman`s long entry for the obvious 39.50$ is the backtest of the 32.50$ buy point what could come true within course of next week as the Top-Leaders of this rally, Barrick Gold and Newmont Mining, again settled positive on Friday, but that made for a second consecutive back candle what is increasingly suggestive of a bullish exhaustion and leans shortterm bearish for them and therefore also the GDX.
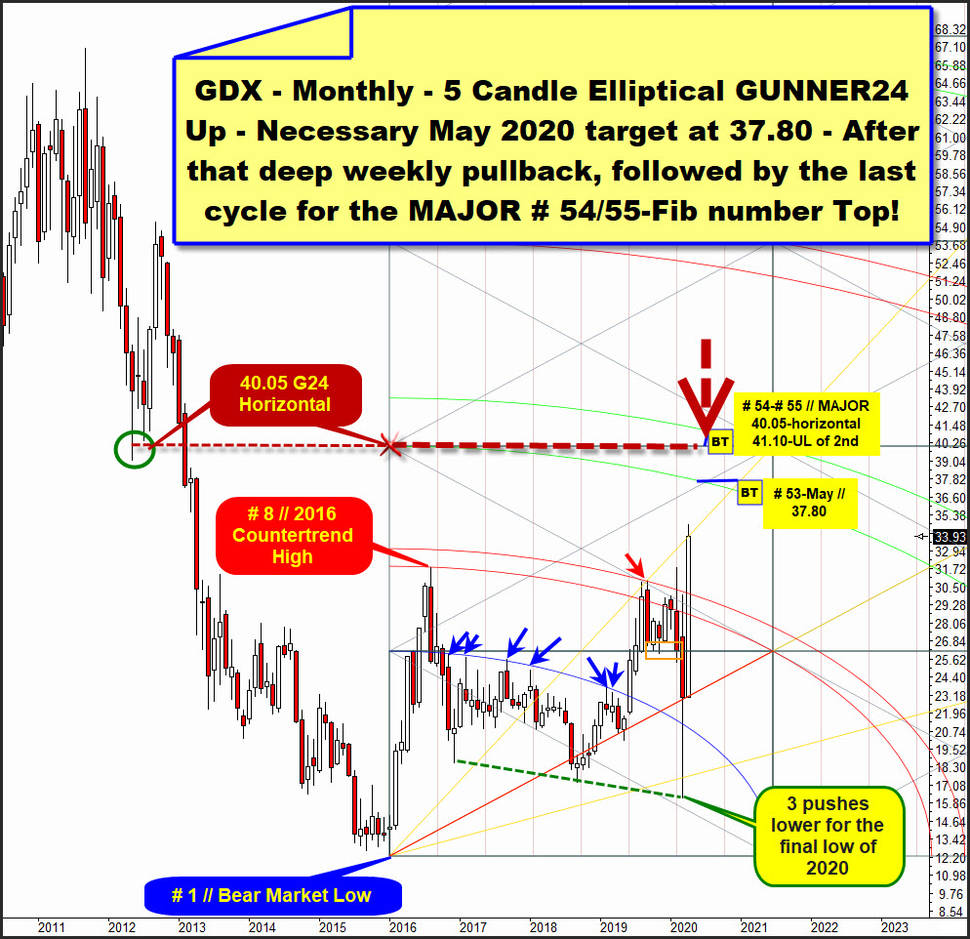
After a possibly due larger -5% to -10% pullback to correct this +13% rally week the GDX should turn higher again and should reach at least 37.80$ in course of May 2020:
This next higher nearest important monthly uptarget work off offers the at # 1 // Bear Market Low anchored monthly elliptical 5 Fib number Candle GUNNER24 Up Setup which best tracks the major trend waves and extremes of this underway yearlong bear market, IMO.
With the elliptical fine tuning technique we can hit the highest possible number of passed turning points and extremes at the time lines and price contacts to the square lines as well as the pricing at the Blue Arc and at the double arcs.
Cause the more precise hits we recognize the more we will be able to depict the future price development, including the coming, perhaps very due price areas and points the trend has or wants to reach/work off.
The most important milestones of the elliptical 5 Candle up I have highlighted with the red and blue arrows and the orange box which shows the confirmed importance of the first square line. The sheer quantity of these exactly captured waymarks results in unusual high signal reliability and future target accuracy.
==> Watch still underway April 2020 candle which now finally breaks elliptical 1st double arc resistance = very-confirmed = very-strong yearly and additionally DECADElong resistance area.
And this slamming buy signal must almost inevitably lead to the very fast processing of the next higher elliptic double arc line what is the lower line of 2nd which runs at 37.80$ for the May 2020 candle.
==> Here is my hard GDX call: The instrument has to work off 37.50$ in course of May 2020!
However and a little bit more bullish is this:
We know from the analysis of the first chart the now underway buy signal/giant SSS-H-SSS neckline breakout is a long signal on DECADE base that has unusual high odd to do a 39.50$ at minimum and the 39.50$ is the nearest upmagnet on CENTURY base.
Therefore and usually the elliptical lower line of 2nd will be overshoot and overrun within this weekly & monthly breakout cycle.
This is a necessity with regard to the price factor and the strong bull energy that is now probably the determining factor, which probably exists because an upward magnet in the CENTURY time frame should attract the price advance. But if now the lower line of 2nd is or is expected to be crossed, the upper line of a double arc automatically becomes the next higher most attractive upward target. And this upper line of 2nd double arc runs around the 41.10$ for the July 2020 candle which then will be the 55th monthly candle of the yearlong countertrend which was triggered at # 1 // year 2016 Low.
Perhaps this rally stops and ends near the 40$ what is a natural important future GUNNER24 Horizontal out of the above measured 5 Fib number initial upimpulse and what is directly connectable to the major important lows of 2012, what have been the very last resort before in course of 2013 the ugliest Gold Stocks bear signal of the entire century was triggered.
This situation makes me think – 70% probability - that GDX has to test at least the "round" 40$ within this breakout cycle... and maybe prints it`s final year highs near or close to the upper line of 2st double arc uptarget magnet around the 41.10$...
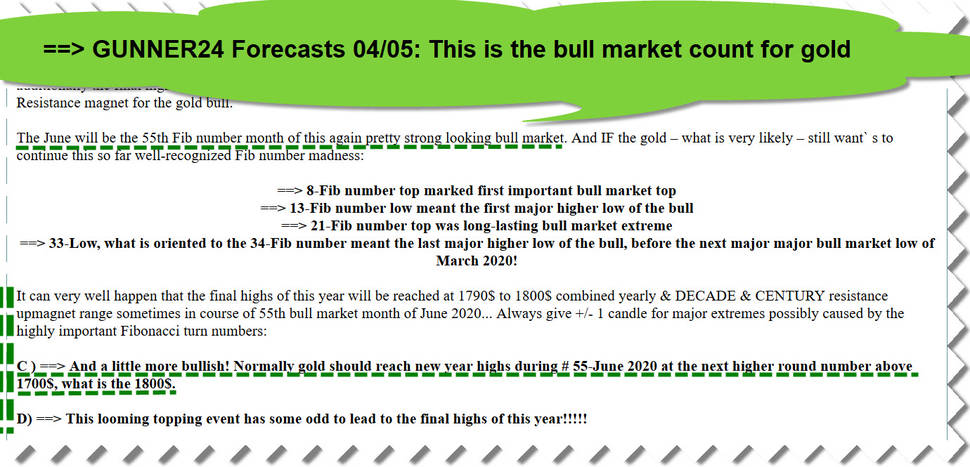
Somehow with this Gold Seniors breakout after a 51 month long more or less sideways market at least 1 more market piece has joined the gold what so far was the only important market segment in the quite broad Gold and Silver Sector that signals future important intermediate highs should come true, respective likely will come true at the beginning of summer 2020 caused by the mostly always trend influencing 55 Fib turn number:
Perhaps the GDX finally tops and turns at the same day or within the same week as the gold. We have to watch such possible stuff closely.
In any case the June to July 2020 time frame must be a really hot place where the current Gold Bugs euphoria could exhaust and end, afterwards followed by a deep 4-8 months lasting bear market. Perhaps the announcement of a vaccine could be the news that will be responsible for the yearly highs in gold and most of the large cap mining stocks.
Be a part of our exclusive sworn GUNNER24 Trader Community – now... I try to make you rich!
- with daily trades – quick, safe and profitable…
- in well-chosen precious metals, commodities, indexes, currencies and in the best trending stocks worldwide...
- in both rising and falling markets…
- with little use of capital…
Be prepared!
Eduard Altmann


