Crude Oil in lookstep with its equivalent USO (United States Oil Fund) cemented intermediate bull market highs in course of March and both have started correction cycles which usually should only mean a longer pause within underway yearslong bull markets which started at the final lows of March 2020 and likely have to continue into 2022.
For USO EPN, the bull market waves present like this:
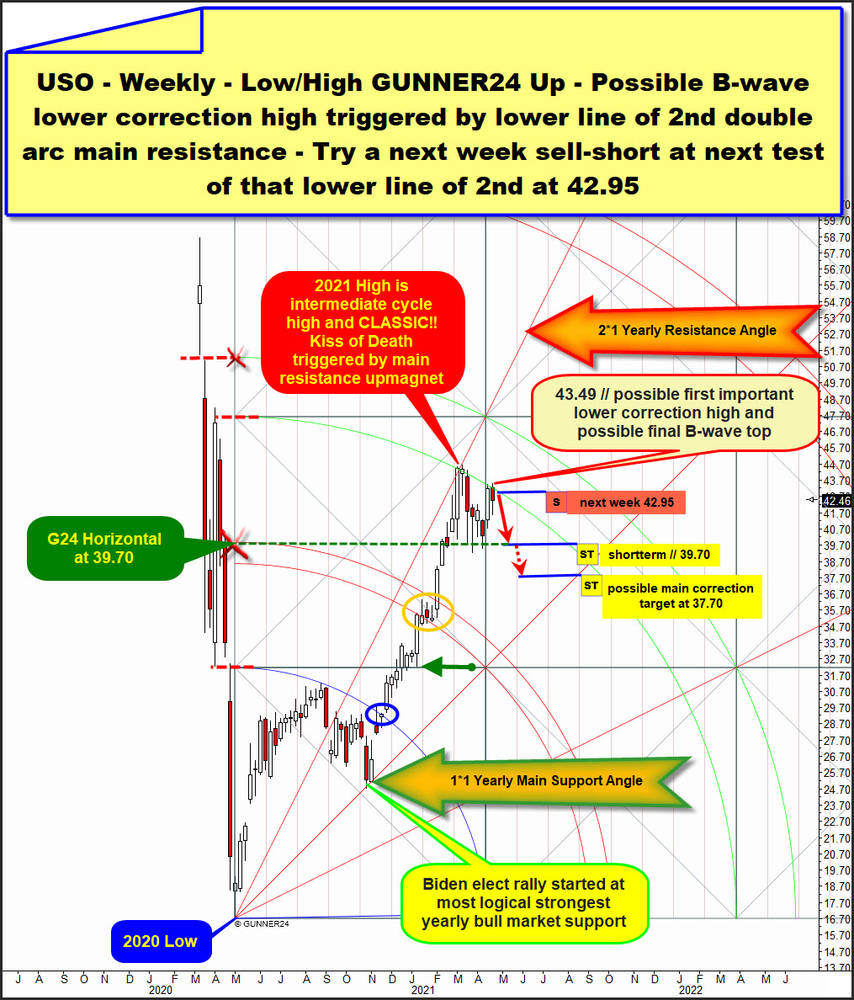
We observe the weekly chart and apply the best-working GUNNER24 Up Setup what is a Low/High up setup as it measures from final low of 2020 up to the very first intermediate cycle high of 2020 what is the August 2020 extreme.
Therefore the Blue Arc represented a kind of a yearly resistance rail until it was finally broken to the upside at small blue oval time window. In case of USO the Biden elect rally cycle started at the cycle lows, printed late-October 2020. This very strong and long rally cycle began at very logical and natural major rising support rail what is the 1*1 Bull Market Gann Angle. Biden elect rally started at natural 1*1 Yearly Main Support Angle and by this we have got confirmation that the 1*1 Yearly Main Support Angle likely will represent most strongest future support rail for the entire year 2021 and beyond. The first future weekly close below the 1*1 Yearly Main Support Angle means the very first major oil sell-short signal, usually...
Ok, we realize that the 1*1 Angle is both, a good- confirmed and a precisily-confirmed support item out of the past. In this context, we are next looking at the current high of this year what with 99% precision arrived at the natural GUNNER24 Uptarget of lower line of 2nd double arc and at same time is a perfect accurate negative test of the 2*1 Gann Angle from below, followed by now underway weekly correction cycle.
==> 1*1 Angle offered major support at first and last test and 2*1 Gann Angle became confirmed main resistance by 2021 highs trend change event and at its first hit from below. ==> the 1*1 is a rising support on yearly base and the 2*1 is a Gann Angle what is also important on a yearly base cause so far 2021 Top was triggered by the 2*1 Yearly Resistance Energy state.
==> The so far 2021 High is triggered by a combined resistance magnet, that formed by the 2*1 Yearly Resistance Angle and the natural lower line of 2nd double arc which has now been falling weekly resistance on both, A) weekly closing base and B) week high base.
Because the so far 2021 High found combined yearly and weekly resistance magnet and this magnet triggered the very first weekly corrective cycle after an about 5-month rally cycle we know that the so far 2021 Top marked an intermediate cycle high and with high odd was a Kiss of Death triggered by a main resistance upmagnet and from such a Kiss of Death "topping event" we may conclude that the oil should now continue to correct for a longer period of time and that it should normally print further correction than previously reached. So far, the low of the USO correction cycle is at a 39.27$ (A-wave low!?).
The lower line of 2nd double arc is a falling resistance that has been re-tested negatively 4!! times so far and may have cemented the very first important lower weekly correction high at this week 43.49$ high. Therefore, we want to open with high confidence a sell-short position at the lower line of 2nd what runs at around 42.95$ for the coming trading week.
At the moment, I suspect that the current corrective cycle will have about the same time span as the corrective cycle that started after the high of August 2020 what defines the Blue Arc location. That is where the very first intermediate bull market high after the coronavirus panic low has formed...
After the intermediate August 2020 cycle top, there was a 10/11-week correction cycle, what formed an about 2-month Bear Flag (2020 Bear Flag) pattern, which first dissolved to the downside, only to set a classic SEVERE Bear Trap followed by the powerful Biden-elect rally starting at the 1*1 Yearly Main Support Angle.
==> IMHO, USO shares since 2021 Top work on a classic monthslong ABC-correction pattern where this week's high probably marks the final B-wave (countertrend-) top. Accordingly, a next weekslong C-wave down should actually already have begun.
Watch it closely: There is a prior confirmed natural weekly GUNNER24 Support Horizontal out of the highest possible price of the upper line of 1st double arc what is 39.70$. This natural and strong weekly support horizontal is 3 times successful backtested main support of the running correction and I think the likely underway C-wave down has to test back the 39.70$ once again, since the 39.70$ for the next 2,3 week candles is a future TRIPLE support on the weekly chart. Thus 39.70$ should once again offer heavy-support at possibly due next backtest!
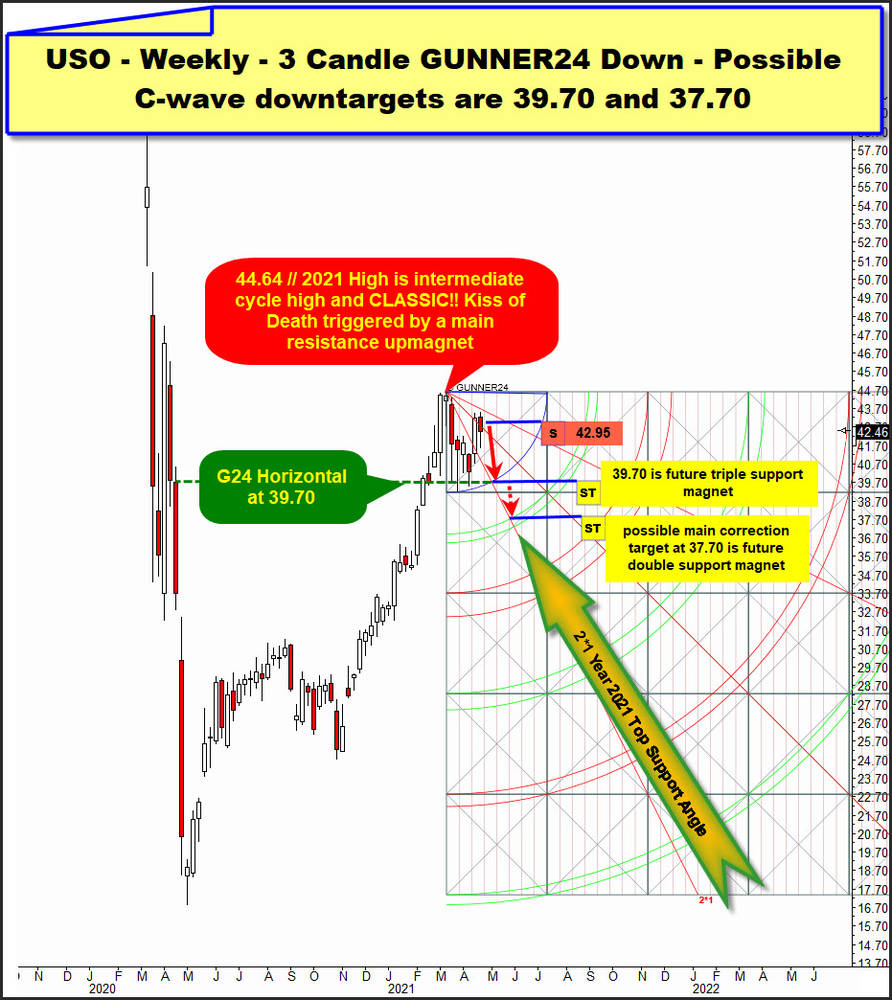
When we now overlay a classic weekly 3 Fib number Candle GUNNER24 Down Setup and let this downtrend measurement start at 2021 Kiss of Death bull market high we recognize...:
... that the Blue Arc forms 3 times successfully tested correction main support and the GUNNER24 Horizontal together with the on weekly closing base re-conquered 2*1 Year 2021 Top Support Angle at the mentioned 39.70$ unites to a future weekly triple support magnet for the trading week May 10-14!
Future GUNNER 24 Triple Magnets are always natural major attractive price points and an USO C-wave correction low could come in at or near the weekly 39.70$ support attraction.
==> Shortterm downtarget seems to be the weekly triple support magnet at 37.40$! It could be worked off within the next 3 week candles.
In the negative outcome that this corrective cycle until mid-May prints a clear weekly close below the 37.40$ triple support the future weekly double support magnet at 37.70$ formed by upper line of 1st potential GUNNER24 Down Target and the re-conquered 2*1 Year 2021 Top Support Angle automatically becomes next lower most important downtarget for the USO shares.
Final C-Wave correction lows could be seen at the lower line of 1st double arc support environment, cause after the recently seen very hard and long rally this downtarget area from experience offers the most natural strongest future correction support point.
==> The possible main downtarget/C-wave downtarget for the entire correction is a weekly GUNNER24 Double Support magnet at 37.70$! It could be worked off within next 3 to 5 week candles.
Be a part of our exclusive sworn GUNNER24 Trader Community – now... I try to make you rich!
- with daily trades – quick, safe and profitable…
- in well-chosen precious metals, commodities, indexes, currencies and in the best trending stocks worldwide...
- in both rising and falling markets…
- with little use of capital…
Brief announcement: because of the German Labor Day Weekend, the next issue of the free GUNNER24 Forecasts will be mailed again on 05/09/2021.
Be prepared!
Eduard Altmann


