S&P 500: Price meets time at 1215 causing a violent counter reaction
Volcanic eruptions, the Goldman Sachs scandal and the Google figures – what else guys? Which incident is not quoted to give reasons for a sell off and to oracle the new system crash. For me being a forecaster, time and again it's amusing to see the whole media pack panting behind thousands of reasons for tops or lows.
It's a shame after all how much the investors are taken the mickey out of by the analyst and media mob. For at the same time it's very simple:
Price meets time:
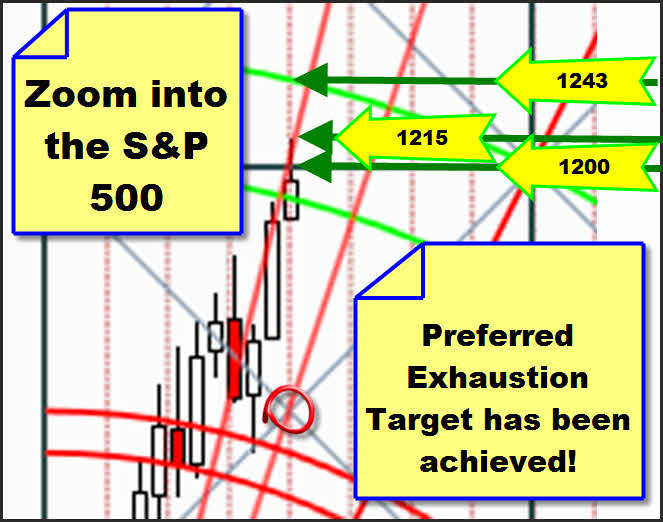
As predicted for months (GUNNER24 Forecasts, Issue 11/15/2009) the S&P 500 reached its preferred exhaustion target last week causing thus a violent counter reaction.
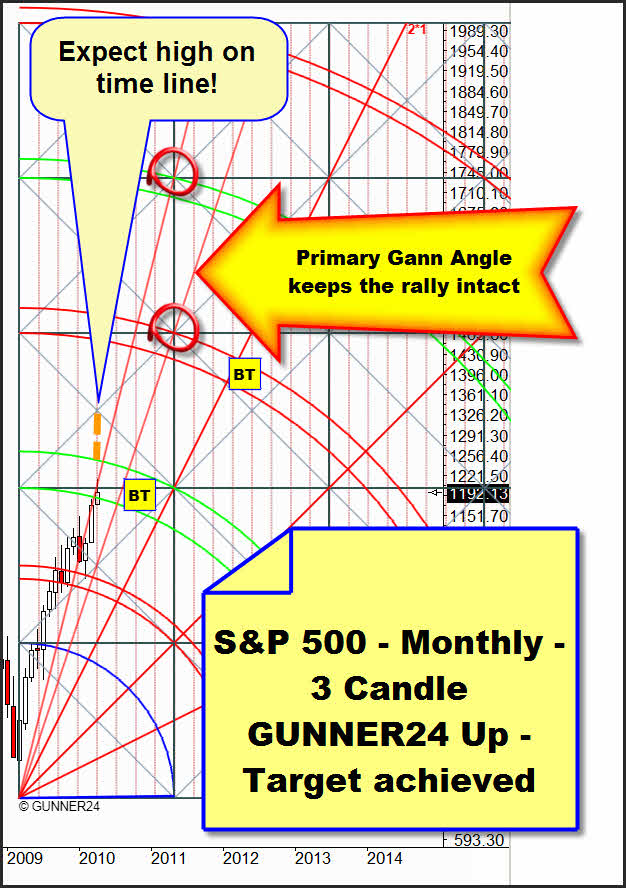
For the majority of the investors (by the GUNNER24 Initial Impulse) from March to May 2009 already defined the main target of 1215 reached on Thursday.
The GUNNER24 Initial Impulse is the real and true impulse which the majority of the investors initiate and which the majority of the investors carry until the very majority quit. That impulse the GUNNER24 Initial Impulse is based on the supposition that the financial markets as well as our lives, our decisions, simply our entire environment go through cycles which can be measured.
When the majority stops following, the first trend move (initial impulse) is phased out. Based on this first impulse we can project precisely the course and the frame of the further price development. If you apply now the GUNNER24 you will not only realize there are space and time structures within the price fixing, but after studying intensely the GUNNER24 Forecasting Method you will be able to slip that discovery successfully into your trading, as well.
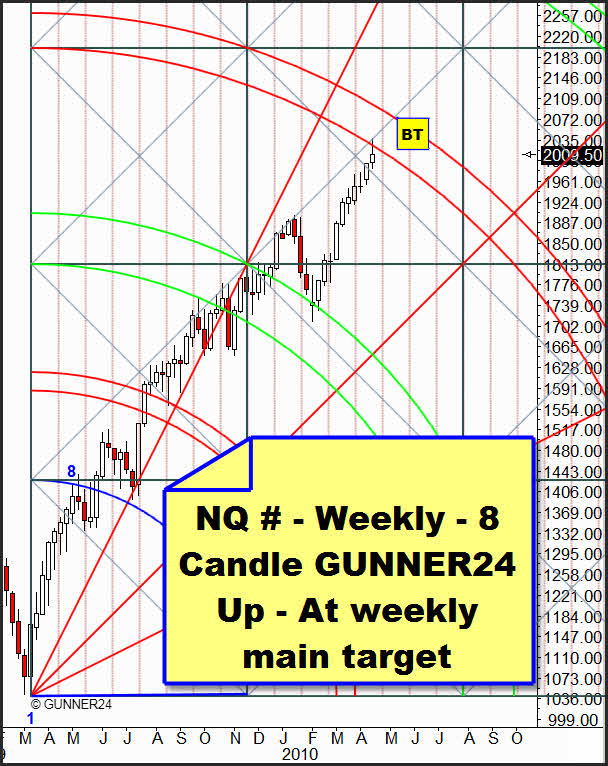
In this weekly 8 Candle GUNNER24 Up, the NQ # contract, too, reached its main target thus releasing a little sell off on daily basis.
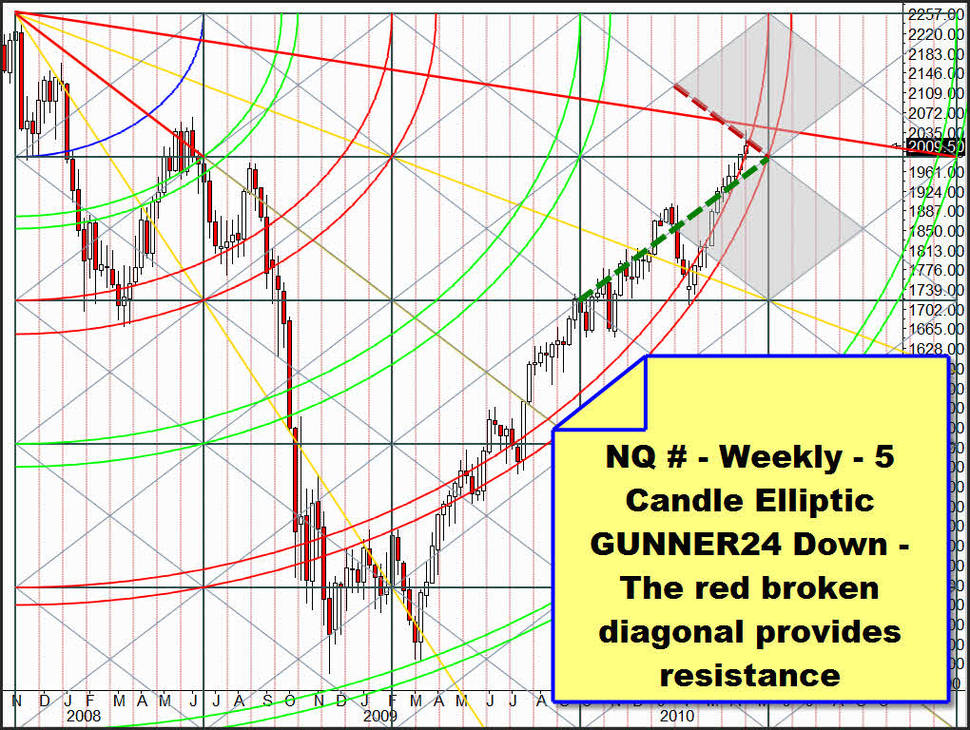
Like I did repeatedly (GUNNER24 Forecasts, Issues 04/11/2010 and 03/28/2010) in this issue again I will deal with the very important weekly 5 Candle Elliptic GUNNER24 Down Setup of the NQ # because I feel it describes the actual market situation best. For that, let's zoom again into the setup:
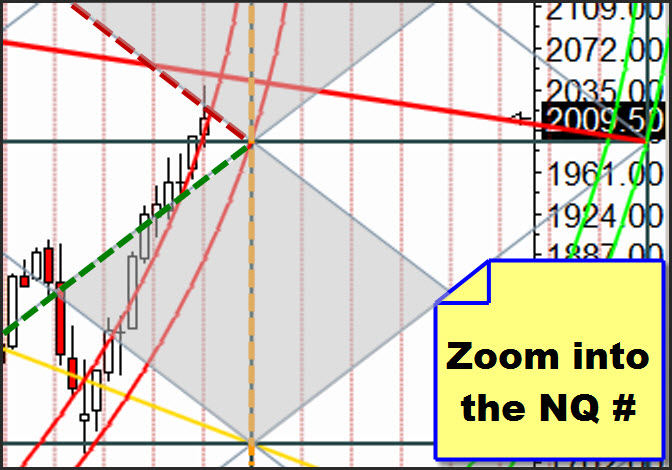
Last week, the market closed narrowly under the broken red diagonal that is offering considerable resistance. But in its exhaustion move, it also followed the red double upwards last week. The broken orange important time line is temporally limiting the exhaustion move to the 05/05/2010. That means, until that date the double arc is going to offer support, really not permitting a big sell off on weekly basis. The Gann Angle above the price that comes from the high of 2007 is most likely impeding an outbreak upwards.
Further we recognize that the price next week is going to open within the double arc and that at the broken green line there is a mighty support diagonal offering its backing..
Opening thus within the double arc, the price is in a sphere that may cause impetuous ups and downs because within those double arc spheres always incalculable forces prevail, downwards as well as upwards. At the same time, during the coming two or three weeks the price might be forced into the sphere that is shaped by the support and resistance diagonals, as to speak be squeezed into the acute corner formed by both diagonals.
Anyway, within the next three weeks the situation will have to dissolve violently, upwards or downwards, respectively! Top formations always take more time than bottom formations. I suppose very seriously that the situation will be dissolved downwards, when the temporal influence of the 4th double arc will have been finished at the latest. Not before the broken green support diagonal will have been broken. That should be the sign for a long term short entry!!
In the following setup you see the possible way of the two coming weeks:
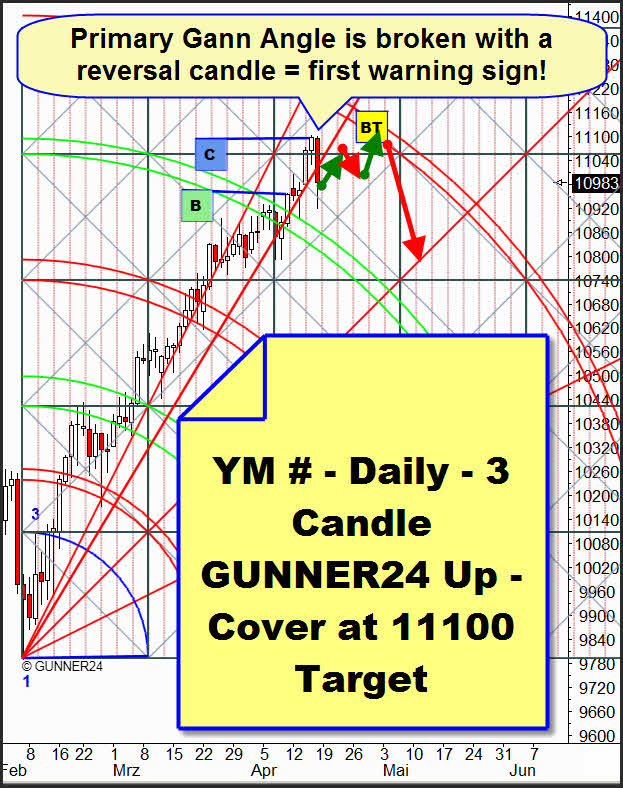
On daily basis, 11100 were reached. By the Thursday top our long positions were covered automatically. On Friday, the primary Gann Angle was broken. Since certainly the price target was reached but in the temporal top the contract has still got a breezing spare this week could rather go sideways as shown in the setup until the 5th double arc is reached following there a double top or a lower high. If the 5th double arc is touched we should go rapidly downwards again, anyway. If the 5th double arc is broken upwards we will go long again on daily basis. Otherwise the recommendation of the last issue keeps being valid:

Since the primary Gann Angle is broken from now on short entries will have to be looked for in day trading and swing trading. SL are those 11100 or the actual highs in all the indexes, respectively.
Gold was successfully damped down until the expiry day just like it had always happened in the respective expiry weeks during the last years.
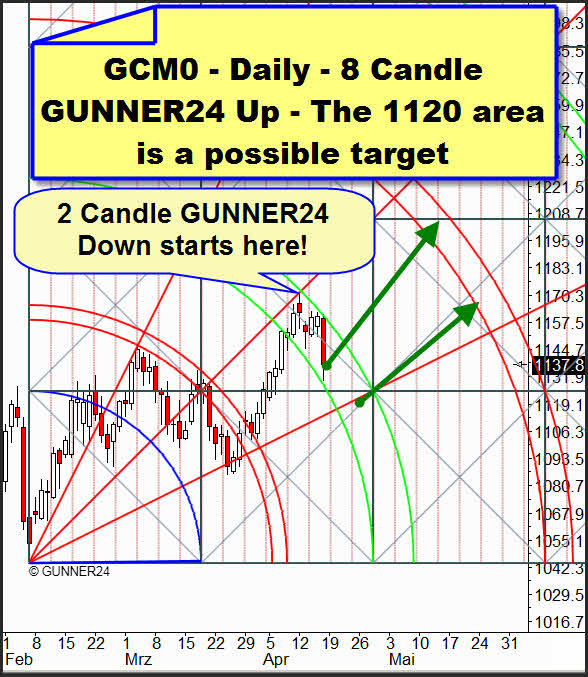
The situation: Monday morning, as announced we covered our longs at the forecast price (GUNNER24 Forecasts, Issue 04/11/2010) at the higher Gann Angle. Since then, a 2 Candle GUNNER24 Down Setup has formed. In the 8 Candle GUNNER24 Up, the price is following the 2nd double arc downwards. That may go on through the end of April. By Friday, in the 2 Candle Down the price is parking exactly above the first double arc. Thus, a target for a counter trend reaction was reached. Correspondingly, as early as Monday the up swing could be continued. Well, we want to build a new long position because the gold is in a clear upwards trend. We will build it up when the 2nd double arc on daily basis will have been broken upwards significantly. But we will also have to reckon on the possibility that the gold price will be passed through 1120 (2nd double arc in the said 2 Candle GUNNER24 Down). At 1120 at the lower 1*2 Gann Angle at the latest, a promising long entry is possible. That's where we will look for the entry with the Gann Angle Reversal technique: Rules 18.4 and 18.5.
Be prepared!
Eduard Altmann

