After predicting the probable short- and medium-term course of the Dow Jones Industrial Average last Sunday, today I am devoting myself to the DAX/FDAX on special trader request. So that also the European-based traders can get a rough idea of how much potential in terms of price and time their European Stock Market indices should still have until the next medium-term highs are likely.
Like always, for my DAX analysis, I refer to charts of the DAX futures contract FDAX.
The FDAX closed the week at 12041 pts and is now just 400-450 points away from its supposed spring-top environment. That's now only 2, 3 stronger uptrend days until then... European traders should therefore use the current upward wave to reduce long-term long positions and cover mid-term oriented longs cause overcoming that hurdle after such a strong 4-month rally is very unlikely without first taking a longer breather:
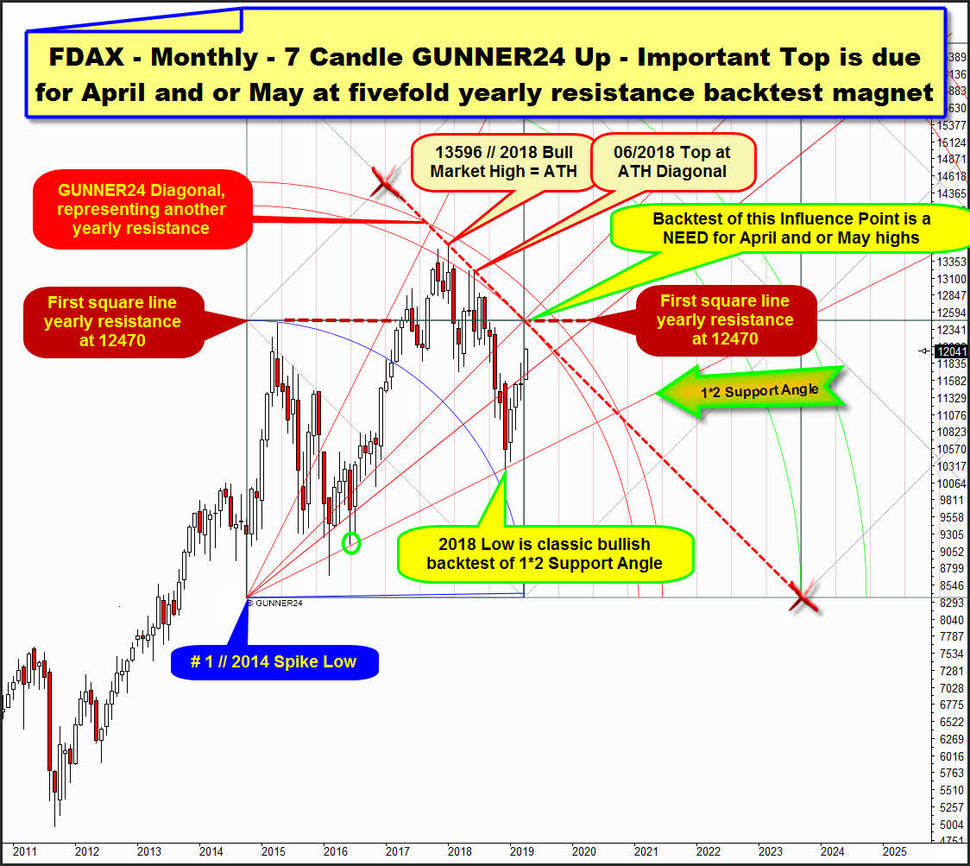
Above is the monthly FDAX candlestick chart together with the one and only valid monthly GUNNER24 Up Setup that starts measuring at # 1 // final low of the year 2014!
This 7 Candle up measures upwards into final high of the year 2015, which at that time was an alltime-high (ATH). So it measures the range from an important year`s low to an alltime-high which always also reflects important resistance in the most important time frames such as the yearly or decade time frames. And as we can undoubtedly see, the in course of January 2018 made 13596 ATH has worked off a natural bull market uptarget out of 2014 Low to 2015 High bull market cycle.
==> FDAX found ATH resistance shy above lower line of 1st double arc natural bull market uptarget within 7 Candle up. The alltime-high has arrived at natural arc resistance, existing in the yearly time frame.
Shortly after the ATH, some more lower month highs found hard resistance at the lower line of the 1st double arc, until finally the last monthly correction cycle gained speed which ended precisely at the 1*2 Support Angle out of # 1 // 2014 Spike Low. There at natural yearly and very strong support of 1*2 Angle, the final 2018 year low was marked over Christmas 2018 and current uptrend cycle began.
The 2018 Low was just the "classic" and a "textbook" backtest of natural strong important Gann Angle! That`s why now running monthly upcycle is a stronger one and a very healthy looking one cause trend just shows higher month highs, higher month lows and higher monthly closings.
Current April 2019 candle is 5th candle of bull market and because the April 2019 candle trades now far, far above a for the first 3 months of the year braking natural Gann Angle resistance FDAX just have to go higher until either in course of this April, or at the latest at the May highs the 12450-12490 pts area is finally worked off.
==> Important Top is due for April and/or May at 12450-12490 pts! There is an irresistible upward magnet for these two month candles.
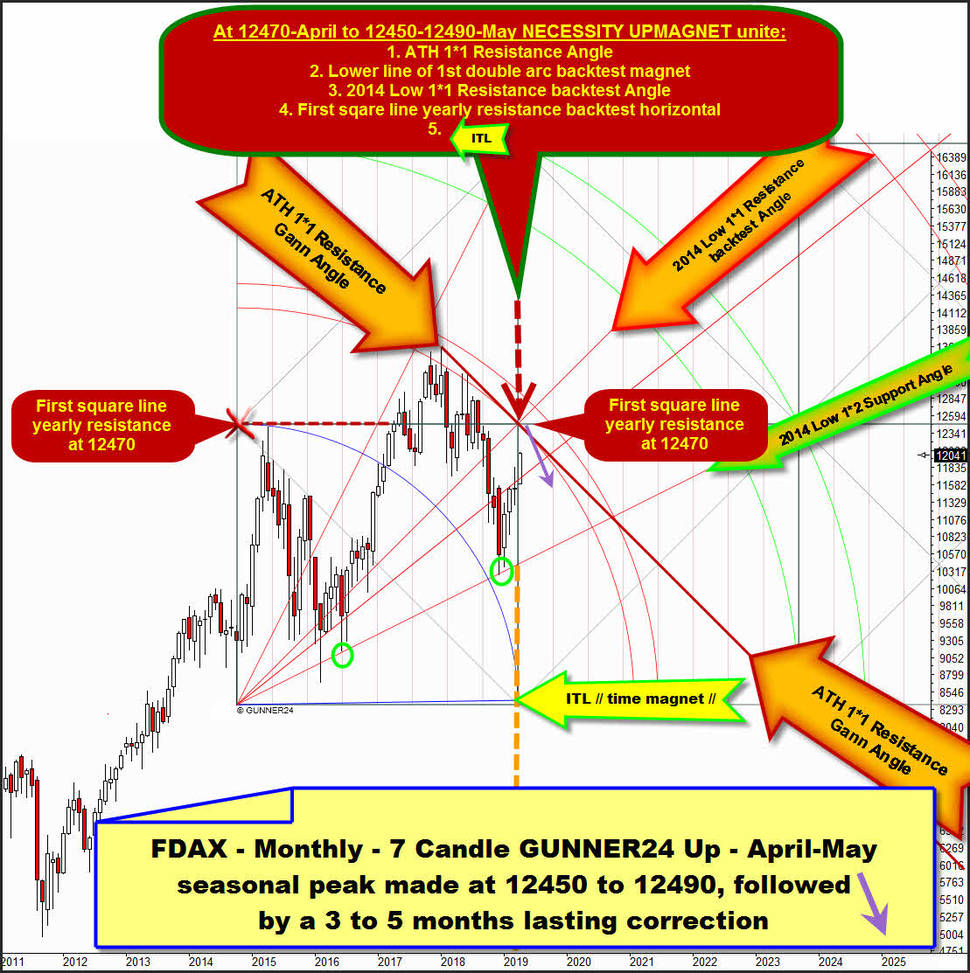
Let me explain the composition of this very unusual and very rare occuring fivefold upward magnet exactly. Therefore, look a last time at the chart above.
The ATH and the lower top of June 2018 precisely found strong resistance at naturally existing GUNNER24 Diagonal. This resistance diagonal I have shown in red-dotted and with the two X. These, like all other setup diagonals and all the other horizontals and verticals are always normal possible attractions for the price, which result from the range of the initial up impulse.
Diagonals in the square always have an angle of 45 degrees... Exactly the same angle the 1*1 Angles have in the square. That's why we can see the following that has evolved at the all-time high:
ATH as lower 06/2018 high form very confirmed, respected falling ATH 1*1 Resistance Gann Angle, which will be tested back now. The FDAX is now serving the market participants the next test of this most important = very strongest resistance that can even be calculated from the ATH!
For the April 2019:
1: ATH 1*1 Resistance Gann Angle &
2: 12470 pts first square line = another future yearly resistance which is a horizontal &
3: The in 2018 often confirmed backtest magnet of lower line of 1st double arc resistance &
the next very, very, very important natural backtest magnet of:
4: 2014 Low 1*1 Resistance backtest Angle together with &
5: Orange-dotted highlighted ITL-vertical, always a possible acting time magnet, form at 12470 pts a combined monthy and yearly fivefold GUNNER24 Backtest Magnet. Fivefold magnets are rare event, and that`s why FDAX is expected to work off that very attractive price stuff soon and within current running monthly bull market upcycle.
==> For the May 2019 candle this highly attractive backtest magnet reduces to a yearly fourfold backtest magnet which runs from 12450 to 12490 pts. Why this?: For May 2019 candle the lower line of 1st backtest magnet runs at 12450 and the 2014 Low 1*1 Resistance backtest Angle takes course at around 12490 pts!
Above you recognize that 12470-April to 12450-12490-May NECESSITY UPMAGNET is highlighted in very dark-red. Means the April/May spring-top area at same time is or represents MAJOR resistance, an existing four-times resistance uptarget magnet on yearly base.
Such stuff usually will not be finally overcome on monthly closing base in course of this monthly upcycle! Rather 12450 to 12490/April to May is just the most ideal MAJOR strong resistance backtest area for the monthly downtrend which is recognizable since ATH, where the nearly always due April-May seasonal peak should arrive!
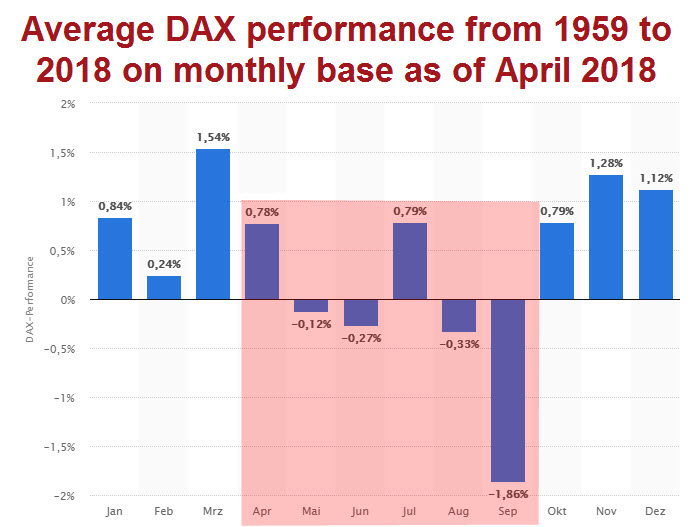
Taking the seasonals into account DAX/FDAX is poised for a 3 to 5 months lasting sideways or digesting cycle after imminent 12450-12490 MAJOR resistance upmagnet test/backtest.
DAX/FDAX has a very secured history of delivering important seasonal highs in the course of April to May,
only to decline therafter ALWAYS!! into August to September time frame.
Well, for a likely just 3 to 5 month candles lasting pullback/digesting cycle, a about -10% price pullback/correction can be expected before the 12450 to 12500 area should be overcome finally on monthly closing base. At least that`s what the GUNNER24 predicts with 70% odd!
==> FDAX is expected to top and turn at 12450-12490 ATH resistance upmagnet until perhaps mid of May 2019! Afterwards market should correct - minimum - into 11200/July 2019!
However, the next really important bull market continuation signal is very easy to identify:
==> Please use the very first monthly close - no matter when it happens - ABOVE 2014 Low 1*1 Resistance backtest Angle as very important bull indication that also this market needs some higher alltime-highs until end of 2020!!
Enjoy and be prepared!
Eduard Altmann


