It’s safe to say, it was unsurprising… After all, gold had yet to reach and finally work off the yearly 1272 GUNNER24 Up Magnet before this uptrend found its next intermediate high. As is well known however, in hindsight you’re always the wiser…
Ultimately, Friday was the day for the turn. Again – just as many times in the past years – the metal rose together with silver by the virtue of overstated angst reaction to political incidents – US missile strike on Syria, previously it had been the Trump vote - into an important intermediate top that couldn’t be held, but if anything it’s a bull trap ringing in a nasty volume-backed intraday reversal:
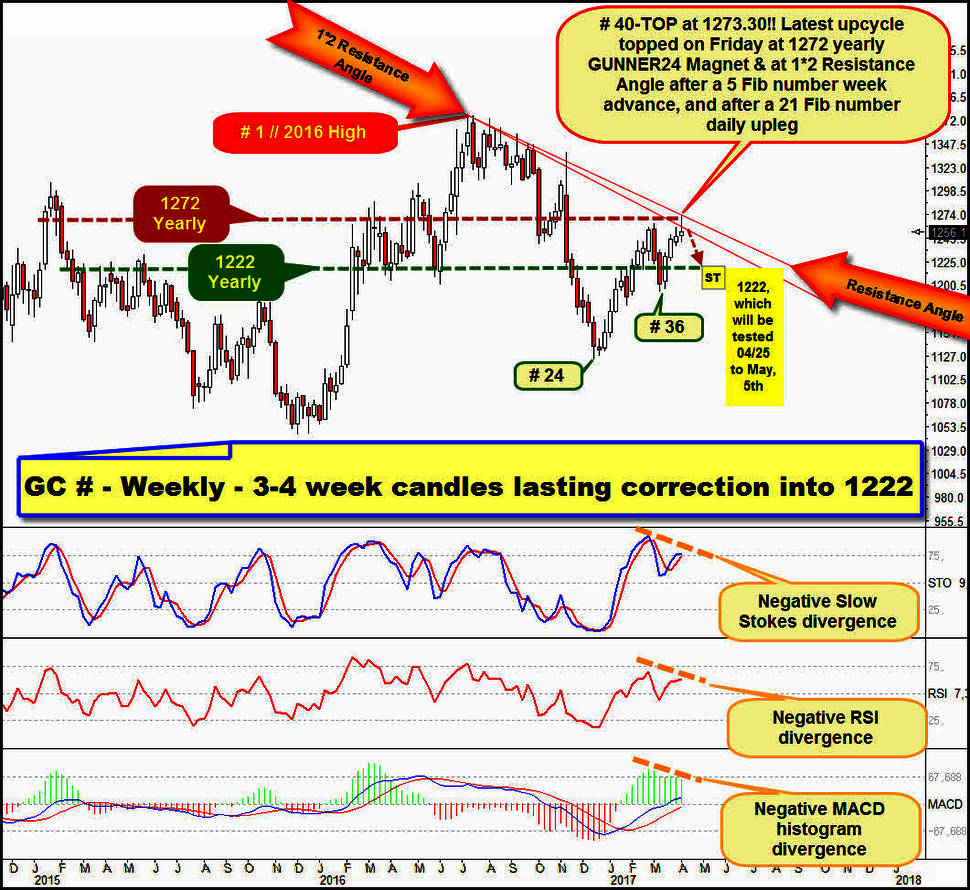
The weekly downtrend that began at the # 1-final 2016 high bottoming at the low of the downtrend week # 24 and reaching a first important higher low, topped and spiked last Friday, being just the day before yesterday in the downtrend week # 40 into the certainly most powerful of all the existing resistances on yearly base, the well-known 1272.
===
Attention, new traders: the importance of the xx22 resp. xx72 magnets for gold in 50$ intervals continues. This condition is going to remain important for many more years. Newbies may read up here what it’s all about with the 50$ resp. 25$ steps gold has been respecting since the year 2012 in a downright maniac way.
===
The new high of the year was marked at 1273.30 on Friday, therewith:
A) For the – perceived - hundredth time since 2012, the 1272 yearly resistance horizontal bared its well-filed claws.
B) exactly at the top, a natural Resistance Angle that can directly be derived from the final high of 2016 was reached, successfully worked off and newly tested negatively. Whose resistance energy, together with the resistance power of the
C) 1*2 Resistance Angle, that can likewise be directly derived from the final high of the year 2016, having been natural and MOST OBJECTIVE attraction magnet for the downtrend and being touched last Friday for the very first time in 2017 were the final triggers for the tough 20$ intraday sell-off shaping the second half of Friday.
Thus, at the top Friday tested 3!! resistances = upmagnets that exist in the yearly time frame. A triple GUNNER24 Resistance Magnet in the yearly time frame was reached, this triple resistance was the catalyst for the bearish character of the Friday close by what the next intermediate top should altogether be cemented definitely now.
To cap it all for the Gold Bugs, the triple 1272 yearly resistance magnet was reached after a 5 week upcycle, after exactly 21 trading days, to make matters even worse.
==> The most recent 5 week upcycle begins at the low of the candle # 36 lasting till the past week candle # 40. The low of # 36 was marked on March 10. The top of # 40 was on April 7 = 21 trading days.
Since 5 and 21 are Fib numbers, they constantly signal possible extrema, they even release them. So, since both the weekly time frame and the daily time frame signal together and simultaneously an important time top that moreover reached a triple GUNNER24 Price Resistance Magnet on yearly base, in the first step gold reacting hard negatively to both the time magnet (5 weeks up/21 trading days up) and the price magnet 1272, indeed we have to state:
==> Price and time met at the Friday top, the new 2017 high. Whenever something like that becomes visible/happens, a change becomes imminent.
==> All the three most important momentum oscillators in the weekly time frame show visible negative divergences, so technically they did not endorse or back the recent 5 week upcycle either. Thereby, also the market technique is pointing to an important intermediate high made on Friday!
==> I dare to put my head above the parapet alleging that even the final high of the year 2017 might have come in on Friday! Probability 80%!
In the first step, gold is most likely to test the 1220-1224 yearly support horizontal again. This test is supposed to be due between April 25 and May 5.
I’d like to underpin this allegation with the currently most important GUNNER24 Up Setup in the weekly time frame.
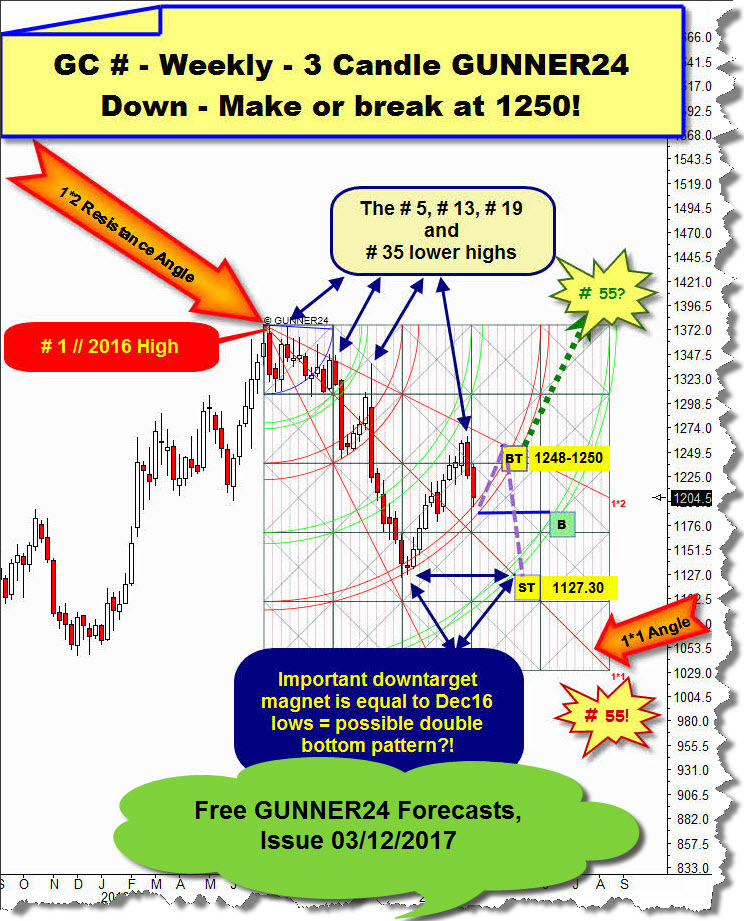
For the first time, I presented you this setup in the so far last free gold analysis. It was on 03/12/2017: "Gold keeps on obscuring its true intensions for 2017":
Just briefly resuming, due to the existing 4th double arc main support, then we had to expect:
I quote myself as saying:
"==> The 4th double arc is radiating support again now! The 4th is an extremely important and actually extremely strong future support double arc. It was the one that inter alia triggered the important higher 1-year-cycle low. Well, the 4th support environment is actually tested just for the second time, according to the rule of three and four being supposed to bear again and give gold overall support at the second test that is currently taking place and thus being able to drive the metal very, very soon into the next weekly upcycle.
==> The coming weekly upcycle should have to work off the 1*2 Angle finally then. For this angle upmagnet is truly behind the red dotted falling resistance that springs directly from the 2016 high..."
And furthermore...
"So, I expect gold to turn coming week to work off resp. reach then the 1*2 Angle within a 3 or 4 or 5, at most 6 week weekly upcycle." ... "This is why I consider as to be most likely that gold shall pursue the purple dotted path. Now it turns upwards at the 4th double arc support within at least 3 to at most 6 trading weeks going up to the 1*2 Resistance Angle, the central dominating resistance of the year. Afterwards, the next lower high in the overall secular bear market will be attained there."
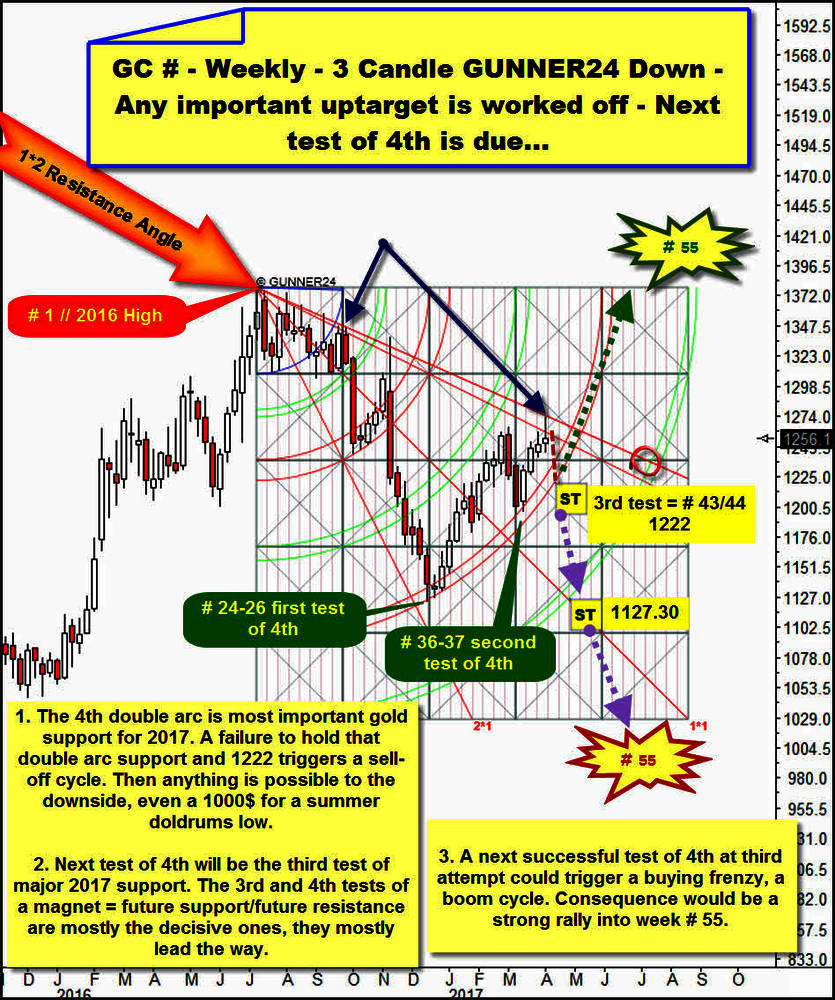
Brief conclusion: So far so good. The recent weekly upcycle topped in week no. 5, at the expected 1*2 Resistance Angle – and the 1272 – into the possible lower high in the overall secular bear market! Update of the 3 Candle down as per Friday close:
Now again, the weekly gold chart is showing the correct and currently dominating price/time scaling.
The two fat dark-blue arrows are showing both exact tests of the Support Angle that can naturally be anchored in the setup at the red-swung graphic oval. Important and bearish is the fact that the last candle could NOT attain the highest weekly close in 2017 and besides was not able to re-conquer the 1*2 Resistance Angle on weekly closing base.
This is the first important bearish signal after a next very likely cemented intermediate top that in addition is supposed to be the next important lower weekly high in the overall bear market!
==> The trend should/might/ought to have changed now, thus really compellingly the 4th double arc – that means the main support double arc for the year 2017 – in the now already current downtrend will newly have to be tested. For me, it’s beyond dispute, that it will come to the next test of the 4th double arc within the next couple of weeks. Thereby, the falling red dotted forecast is valid. Now down to the lower line of the 4th double arc and 1222 yearly support horizontal.
==> These two yearly supports amalgamate for the downtrend weeks # 43, resp. # 44 (more precisely between April 25 and May 5) forming the strongest future support in the yearly time frame, being as well always a future most attracting downmagnet after all.
Then – and this is what I expect now – it will come to the third test of this yearly support double arc!
The meaningfulness and importance of the 4th double arc as important ruling support area for gold was first recognized by us when the final higher 1-year-cycle low of December 2016 was caught by the lower line of the 4th at the low of the downtrend week # 24. Pleasantly confirmed as important support was for the first time the lower line of the 4th because the small higher lows of # 25 + # 26 were likewise released most exactly by the lower line of the 4th.
After the reached higher lows of # 36 and # 37, the 4th became the dominating and powerful support in the yearly time frame. The most recent 5 week uptrend started at the important higher low on yearly base of # 36 after all!
Ok, what is heading now the Gold Traders’ way at the likely soon due third test of the 4th?!
I just say it quite profanely: It’s the deciding battle that will determine the outcome and course of the trading year 2017!!
If the 4th together with the 1222 doesn’t bear but falls within three to four weeks, so that was it for 2017, then the falling purple dotted arrow options will come into play mightily gold being supposed to be able to test at least the December 2016 low at 1127.30 with the summer doldrums low – to be expected in that case, as usual in June/July.
==> If the 4th support falls together with the 1222 till May, officially even a so-called sell-off cycle will be triggered - so gold may decline below the 1000$ mark in the worst case – that won’t be able/supposed to find its next important low before around the downtrend week # 55.
If the 4th double arc bears and supports also at the upcoming third test, there will be a good chance for this next successful test to release a so-called boom cycle. At the extreme, the result of that would be a massive, super strong rally that will be supposed to last 8 to 12 weeks then reaching with ease the 2016 high environment (1350-1372) and perhaps overshooting it! In the very worst case, it should come at least to small higher 2017 highs however (at about 1300!! for week # 55!).
Well, what I bet on and what I tend to assume is the sketched purple arrow course: Owing to its seasonality, by tradition only for a couple of more weeks gold is endorsed bullish. Then, it’s predestined to dive into the traditionally bearish summer-doldrums months. I think, a backtest of the December 2016 low at 1120-1130 for a summer-doldrums low doesn’t seem to be unrealistic, but even likely!
Be prepared!
Eduard Altmann


