Topping and bottoming out are processes that use to degenerate in enervating and severely persisting grave battles – the bulls fight hard against the bears. Both sides need to employ heavy material to hold and re-conquer their respecting positions. Minimal gains of ground i.e. defending supports and taking or re-conquering resistance lines use to claim a lot of bloodshed on both sides.
A long time may pass until the respective forces in the bull and the bear camps wane inclining the scale to the winner, i.e. to the new trend. Still there is no unambiguous winner to be seen, either in the battle for the stock-market tops or in the fight for the precious metal bottoms, but the pendulum is bending to the contrary now. That means the US stock markets are rolling over now and gold and silver are most likely to have made important lows last Thursday. At least a countertrend rally in gold and silver seems to be underway now:
During the past weeks more and more matured my conviction that it’s impossible for gold to start a lasting uptrend after the important gold lows of 02/21 without strong silver edge protection. Even though gold initiated thoroughly a serious upmove on 02/21, during all those weeks silver didn’t show any upwards dynamics trading sideways for as many as 6 weeks waiting for a new bear attack. The bulls were much too weak finally caving in again heftily now. The result were new silver swing lows at 26.57$:
Can we say: that was it? I think we can. The bears seem to have shot their bolts – for the moment…
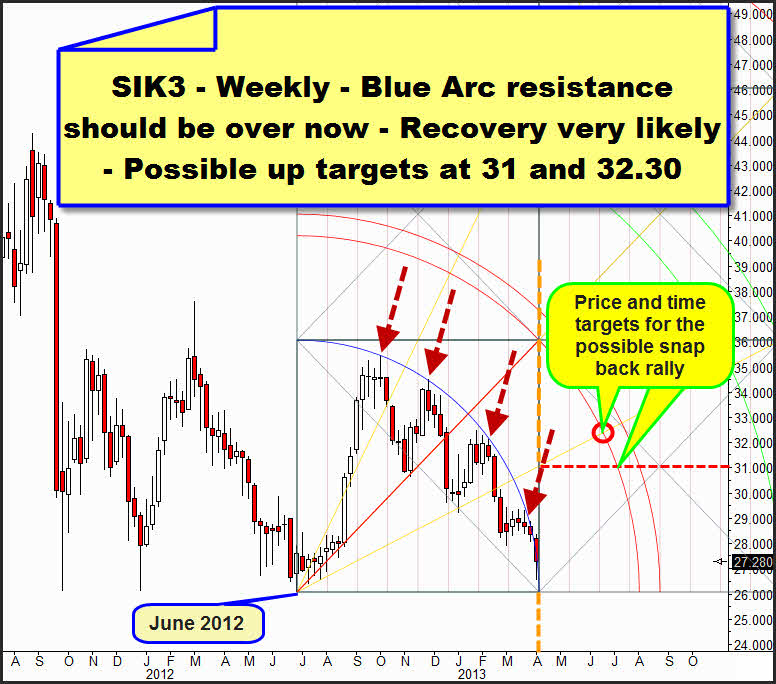
Let’s consider the most important and strongest bear bastion in the weekly silver chart above – the blue elliptical week resistance. We relate the last important upswing beginning in June 2012 with the weekly highs produced since then recognizing on the one hand that the resistance of the Blue Arc of last week is cutting the time line. I.e. concretely the temporal influence of this resistance is supposed to have come to an end last week. The most important weekly resistance is not likely to exert large influence any more.
Secondly with the daily Friday reversal = buy signal on daily base a thoroughly pretty considerable weekly close was reached. And if next week opens just approximately on the same level as last week closed, that is about 27-27.30 – we have to work on that assumption at a 100% - even the price resistance of the Blue Arc will have been skipped over. The opening price is going to be above the Blue Arc. Thus the most important price resistance will be skipped as well. In terms of price as well as time the actually most important weekly resistance will be taken thus.
A countertrend rally up to both next important weekly resistances – either the horizontal at 31$ till June 2013 or even up to the first double arc at 32$ - is possible/probable. With the first weekly reversal candle we’ll buy a weekly long-position at the week close. We will if the next candle closes above the opening of the actual candle (28.21) or if the weekly close after next is above the close of next week.
The edge protection that silver has to produce is standing now being able to begin a hefty bull counter-attack in the middle of the battle field, together with the main force. But gold has to be prepared to fight back now. Be sure it is!
Before we go into the hefty and bloody artillery battle between the important weekly GUNNER24 Double Arc Resistance and the strong GUNNER24 Gann Angle Support here’s something about the reinforcement situation for the moment: Without that nothing works… a little Fibonacci and W.D. Gann’s rule of three and four:
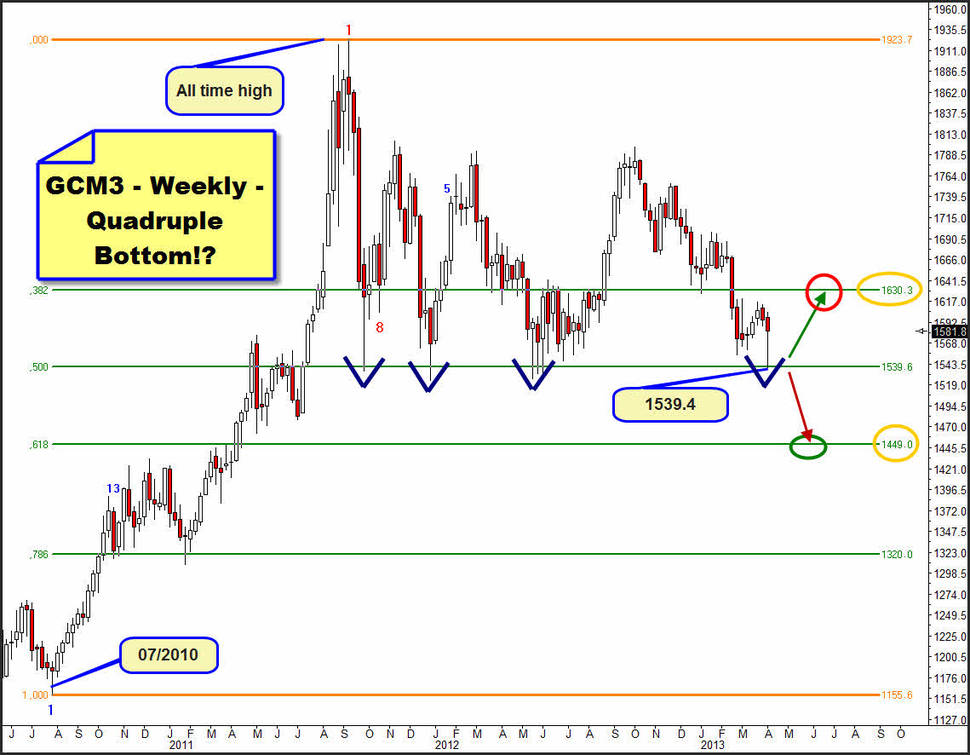
Relating the actually most important weekly low with the all time high we can pass simple analysis. Either the 50% Fibonacci retracement resists also in the fourth test, in this case we’ll have to expect on weekly base at least a snapback rally up to 1630. Or the thing falls at least to 1450$ until June, the 61.80% retracement. That’s it.
According to W.D. Gann the third and the fourth tests of a support are the most important ones. The third successful test of the 50% Fibonacci retracement in May 2012 subsequently led to a pleasant 270$ rally. But often the fourth test is much, much more important than the third.
The fourth successful tests use to be the starting points for a complete change in trend. In case of their success they often form the final bottom of a correction. If the 1540 resist during the coming 3 weeks from there might thoroughly develop a mighty new uptrend being able to overcome subsequently the important 1800$ mark. But this target won’t be activated before the 38.2% Fibonacci retracement at 1630 on weekly closing basis is overcome persistently.
Well the reinforcement ways are free being able to deliver the bulls now ammunitions and food being necessary to break the most important GUNNER24 Resistance persistently.
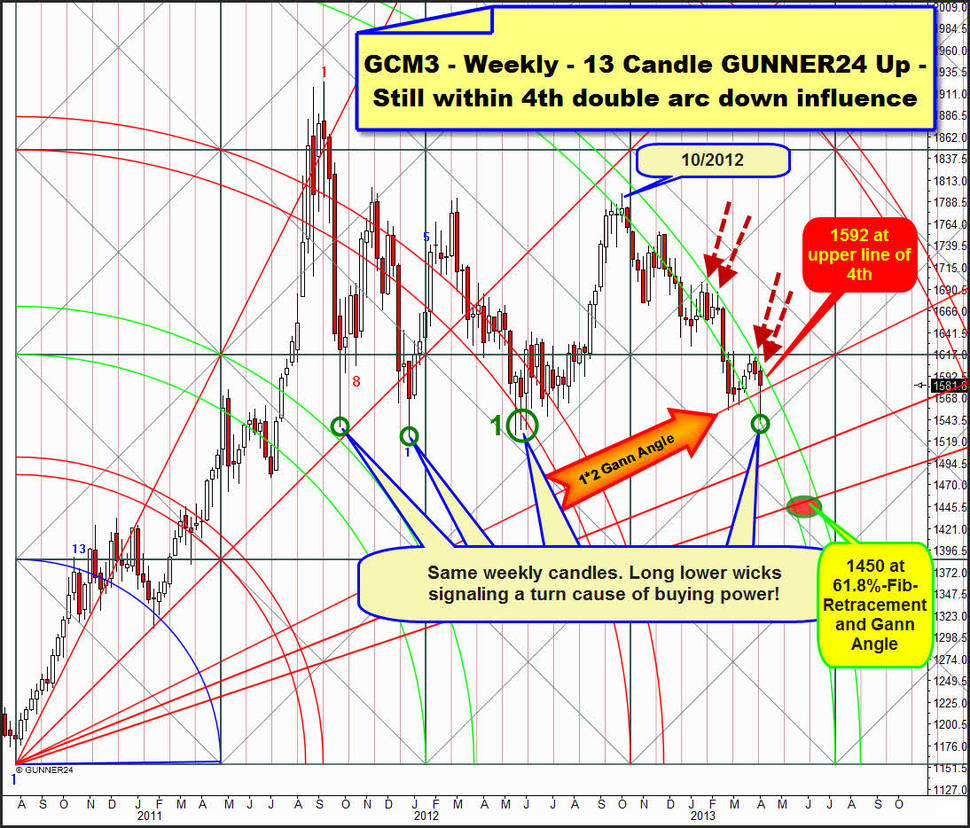
The most important demarcation line is the 4th double arc. According to the GUNNER24 Rules it is often the most important GUNNER24 Resistance, especially in commodities. It’s often inexorable, often deadly for any bull attack. Since October 2012, after reaching the last important weekly highs at 1798$, it has been pressing down the gold. Gold is quoting now within both lines of the 4th.
Either gold succeeds to leave the 4th upwards during the coming 2 weeks or things turn very bitter.
If the most important bull support, the 1*2 Gann Angle breaks unequivocally (weekly close below 1540) during the next 2 weeks gold will be likely to go on following the down pressure of the 4th downwards. Target in this case would be the 61.80% Fibonacci retracement at 1450$! The lowest Support Gann Angle to be seen in the chart above as passing at 1450$ for June 2013!
It’s not a mere coincidence that Friday arose, as if it were driven by a magic hand above the 1*2 Support Gann Angle pretty comfortably. The 1*2 is the actually most important Gann Support. It’s a magic support, a strong magnet. It may be strong enough to ring in a change upwards!
Please pay also attention to the last week candle and just compare it with the candles of the other three tests at 1540. The long lower wick indicates that at 1540 there’s still a very strong buying interest. The buyers newly overwhelm the sellers at 1540 – for the moment at least. They do as they did during the past successful tests of the 1540.
However, whether the turn that started at the last Thursday low is sufficient to overcome the 4th persistently will be shown in the next two weeks. Is the just effected new rejection from the 1540 mark a matter of real buying interest or only short covering? The Battle Royal will be carried out next week at 1592. That’s where we’ll get the first clue whether the 4th can be cracked.
Technically at 1592 (that’s where the upper line of the 4th passes for next week) at the latest next Tuesday a new selling wave would be likely to start that should force gold again to exert a new test of the weekly 1*2 angle again. The upper line of 4th is a strong, powerful resistance. Like in the past the upper line of the 4th should be able to trigger a sell wave…
But if gold consolidates narrowly beneath the 1590 during 1-2 days we’d have a severe sign for the ability of the bulls to win the battle for the 4th double arc.
I think, if the bulls succeed in producing a weekly close above 1600 next week gold will roll through June. We’ll buy at least the first pretty clear weekly close above the upper line of the 4th. This close will be at 1600$ next week. Target will be 1640 MIT (market if touched) then.
Would you, too, like to profit from this possible monster-wave in the precious metals on a large scale? Do you require a service that monitors, controls, analyzes and signals for you all the important moves in gold and silver? If so, go ahead and order just right now the GUNNER24 Gold Trader!
The GUNNER24 Gold Trader will provide you with the critical knowledge you need to forecast and analyse the precious metals with the GUNNER24 Forecasting Method. All the GUNNER24 Trading Signals you receive real-time are based on the actual Gold and Silver Future. The NEW GUNNER24 Gold Trader is a must for every actively working investor and trader who wants to trade successfully in everyday trading. The insights you receive from the head trader Eduard Altmann (and discoverer of the GUNNER24 Forecasting Method) are truly amazing sometimes. I promise!
Click the button below and order the GUNNER24 Gold Trader - $39.90 US a month. For 201 members and up - $49.90 US a month.
For months, I’ve been of the opinion that the precious metals cannot find and rev up a bit subsequently unless the US stock markets flow into their corrections.
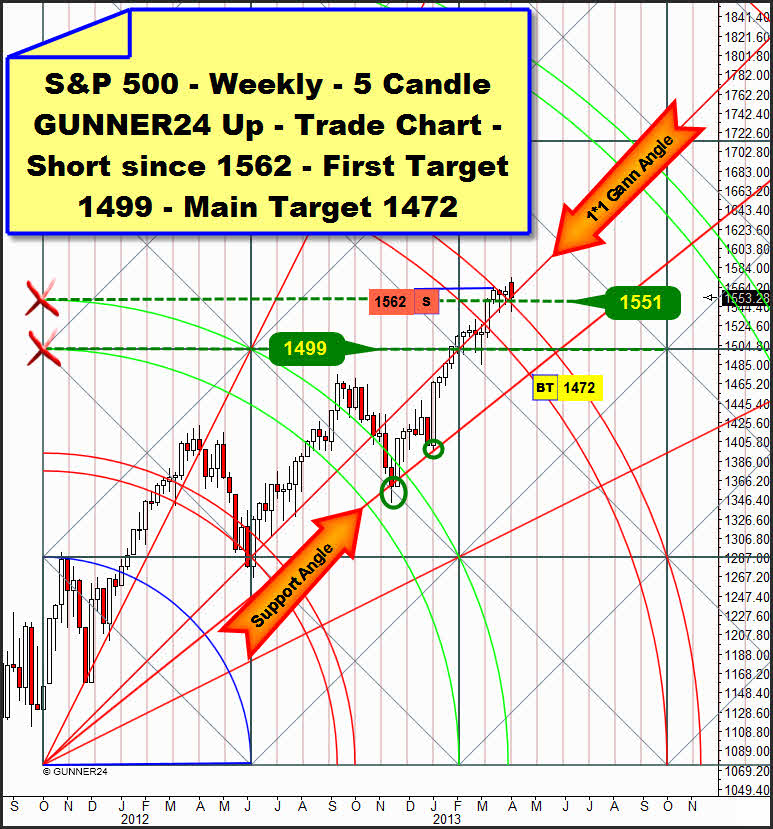
The first correction signs were to be seen there a month ago already. That’s why we went short at 1562 points with a weekly position in the middle of March in the S&P 500. In the Dow Jones, on weekly basis we’ve been short since 14.500.
For as many as 4 weeks the bulls and the bears have been plowing in the Dow and in the S&P 500 severely without gaining any considerable ground, standing as they did 4 weeks ago. Both sides are fighting hard, always succeeding the bulls somehow in producing minimal higher highs and achieving again and again to pull up the markets, prepared for correction. So they were the day before yesterday:
Friday closing prices are always important since they give the tone for the following week. A good Friday close, a beautiful late Friday rally give the conditions for a pretty stable beginning of the week. As I said, like pulled by a magic hand – we could see those events several times the last Fridays. Somebody buys the markets up late, but I don’t think that it is the smart money…
Well, be that as it may, the allies of both indexes, i.e. the European indexes and the NASDAQ-100 are still fleeing… the EU indexes have been in the correction mode for a pretty long time, so is the NASDAQ-100 since Friday.
This time the S&P 500 didn’t get above the 1*1 Gann Angle with the Friday rally. This important weekly support, even the narrow weekly close below the 1*1 is not supposed to mean a very hefty correction, but it is a "little weekly sell signal". Combined with the weekly reversal candle we will have to await the correction now. The market is pretty well hedged from below, because the 3rd double arc is likely to deliver a good support during the coming weeks. Well, because of the now existing support function of the 3rd a hefty sell-off is to be ruled out extremely. 3-4 weekly dips into the lines of the 3rd or weekly closings within the 3rd are to be expected now however, so it will be a rather moderate decline. My target for the correction keeps being the 1472. However, as analyzed as early as two weeks ago, because of the strength of the actual uptrend it’s quite possible that the correction ends up at 1499 already = First Target.
Martial greetings!
Eduard Altmann


