After a month-long rally, which since the beginning of the year, despite increasingly wild price swings, has been able to push ever higher, the gold futures contract reached a 7-year high of 1704.3$ on 9th of March.
And thus worked off our last forecast very well both according to the time and in terms of price.
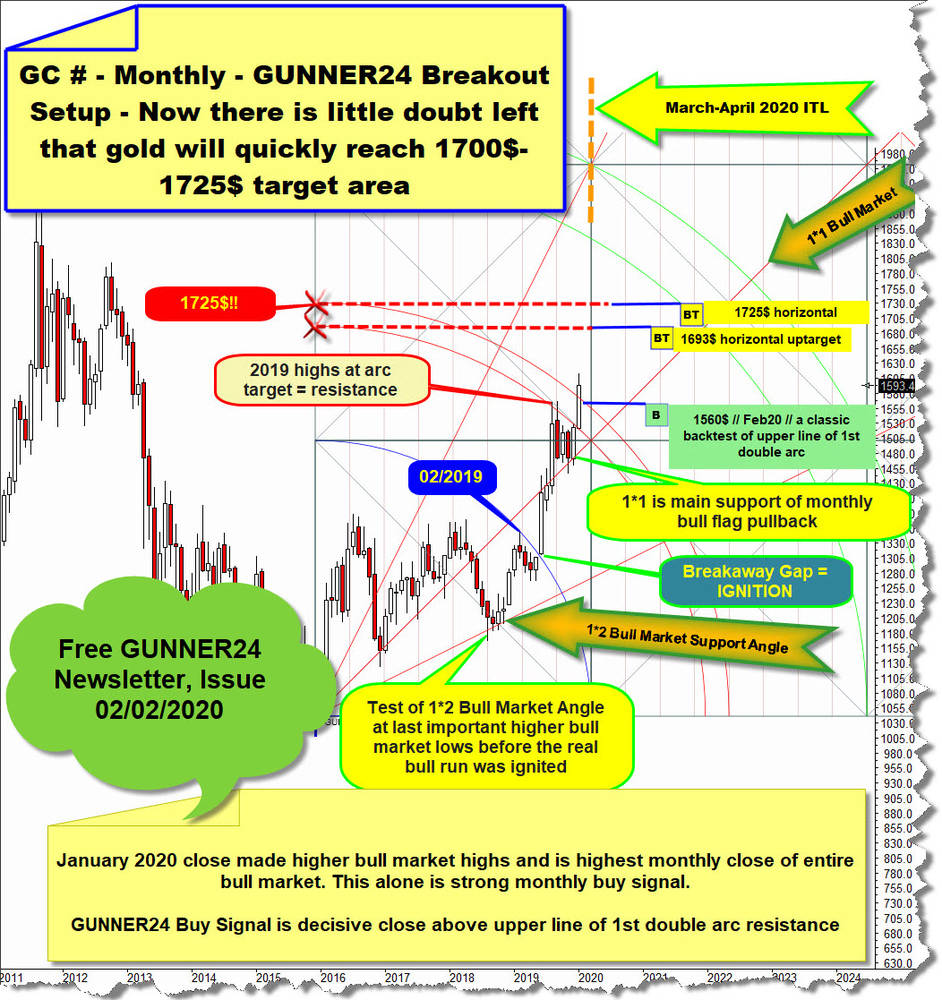
You will find this „Gold Breakout Confirmed => The Resulting Price-Time-Targets" February 2nd forecast here as a reminder. Just click here - click!! - or click on the 02/02/20 forecast-chart above.

With the dramatic collapse of the oil market, the creaking of global supply chains, the complete collapse of the financial markets and the spreading coronavirus panic and the liquidity crunch just getting started the gold price was clubbered also.
Soberly considered, it looks like the coronavirus has popped the "Everything Bubble" and for sure triggered a worldwide recession cycle and maybe even a next „Great Depression in 1929-1932 style" at the end of which everything really went down the drain.
Well, we must now give gold some time to reveal its true future intentions more clearly. It is still confusing regarding the chart technique. Leaving investors, gold bugs, the bears and the traders somewhat undecided.
It is sowing doubts at the moment because it was dropped along with equities, most currencies except the US dollar, most commodities, the metals silver, palladium, platinum and the Gold and Silver Miners. But compared to these other markets, it is actually holding up very well in the beginning Everything Crash. It remains to be seen whether this will continue in the coming days and weeks. This must be assumed, however, as gold always outperforms the vast majority of other assets in recession cycles (10 in the USA since WW II).
And even better, it shines on average with rising prices in a recessionary cycle. That is experience, mathematics or statistics. So a rule of thumb!
Also the GUNNER24 Method remains bullish and very optimistic for gold. So far. Until it is finally proven that the monthly upward trend has come to an end or the entire yearlong bull market has ended.
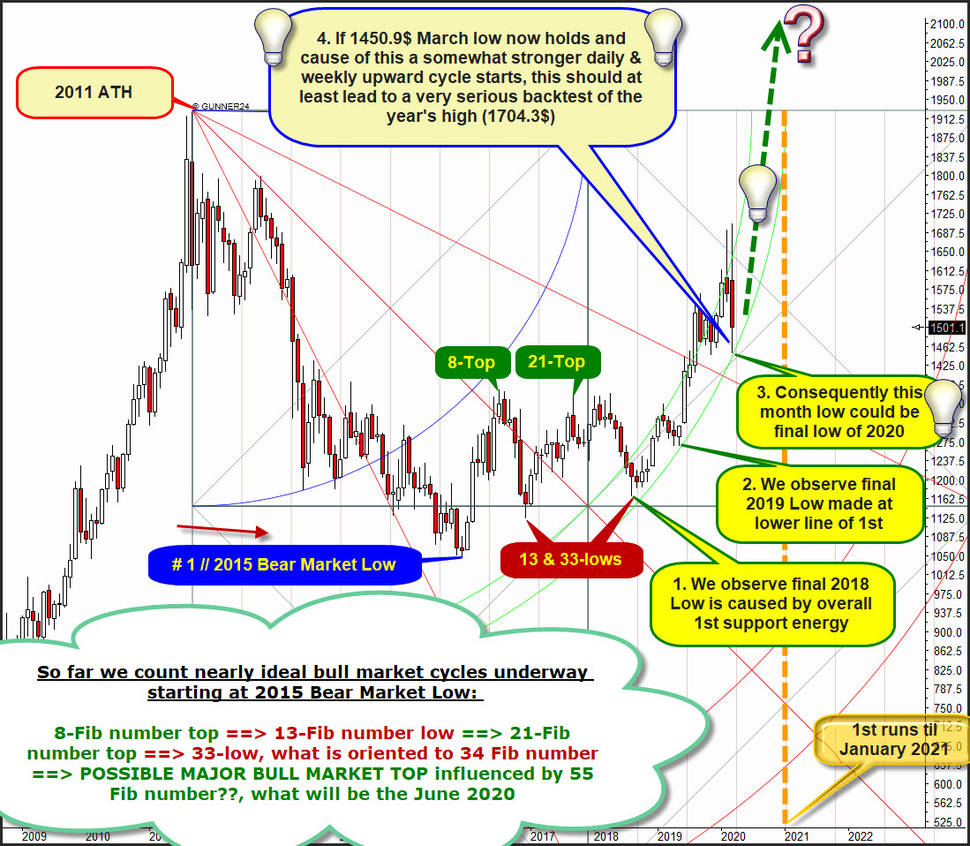
Yes, GUNNER24 even shows us that there is a good chart technical possibility that the low of the week, the current crash low - printed at 1450.9$ - has a nice high odd to become the final low of the entire year 2020. And that is already something positive, even stunning, isn' t it?
Additionally bullish is the fact that a very important earlier activated main target = main upmagnet of the bull market - namely the yearly 1725$ to 1722$ -, see above in the chart, is still open and thus is waiting for its final processing in this bull market cycle.
To justify my view and forecast we have to go back a few years and take a closer look at what the gold did after finalizing its alltime-high (ATH), which as we know was realized in 2011:
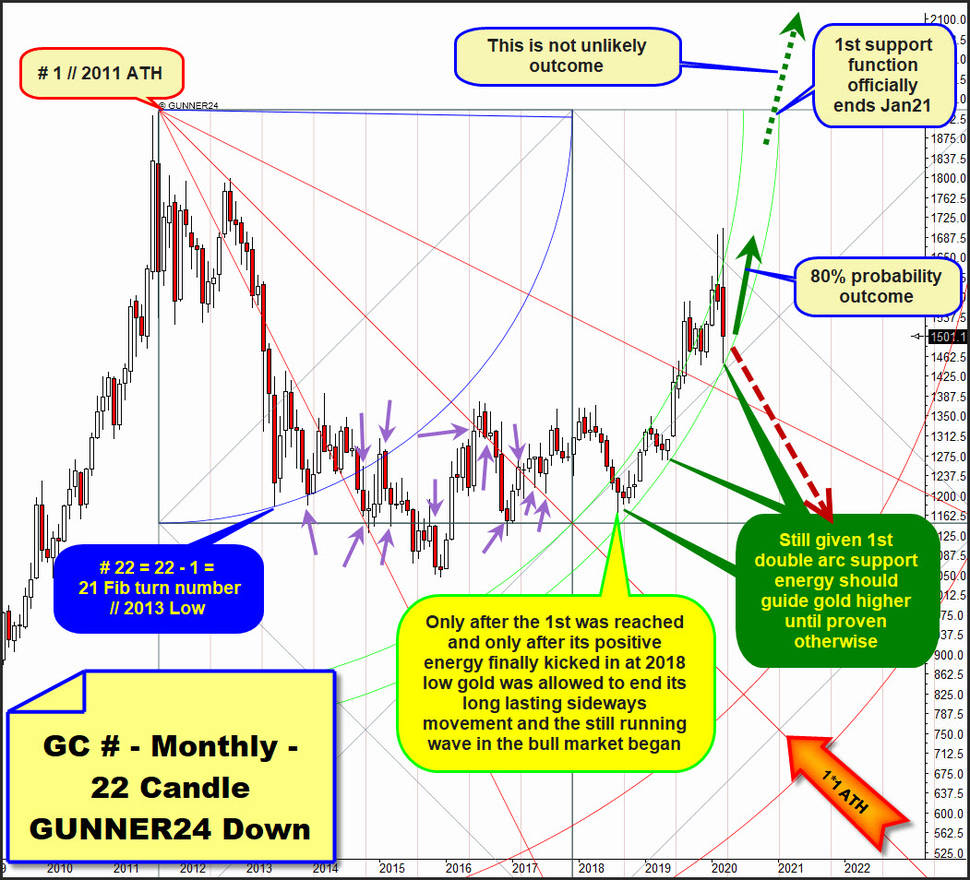
There is a very interesting measurement that starts at the # 1 // 2011 ATH and indicates that the bull is likely to last for several more months. If we apply a 22 Month candles down impulse at ATH candle, which measures the time and price range until the important low of 2013 we observe a downward trend that is 22 month candles long and this is 22 – 1 = 21 natural Fib turn number 21. Therefore totally mass-conform.
This 2013 bear extreme is important waypoint for the previous gold bear cause it triggered a more or less 5-year long sideways cycle that came to end at the important low of 2018 which was the yearly price extreme where the first really strong upward wave of the at 2015 low started bull market became visible.
During its 5-year sideways phase, gold consumed an infinite amount of energy at important monthly extremes which tested, confirmed or usued the always important rails of the setup as supports and resistances. All these many tests of the Blue Arc, the first square line, but also of the 1*1 ATH Gann Angle are highlighted with the purple arrows.
5-year sideways only ended after the price reached 1st double arc support zone and only after the positive energy state of the 1st double arc support energy finally kicked in at made 2018 lows.
==> SINCE printed 2018 lows the bullish power of the 1st double arc support guides the metal higher and higher. With important bull market tops influenced by upper line of 1st which acts more or less as often confirmed most important bull market resistance. And with important higher bull market lows influenced by upward sloping lower line of 1st which radiates most strongest bull market support rail until proven not!
The upper line of 1st resistance is responsible for printing the 2020 highs recently and the subsequent March drop found again support at the lower line of 1st! This upward oriented 1st double arc is responsible rail for that gold marks higher highs and higher lows pattern, what is definition of a bull market!
This double arc guides gold price higher and higher and usually should continue doing so until it`s support function is finally broken or the time influence of this 1st double arc is finally over.
And well, according the GUNNER24 Rules it is fact as long as gold will not close below this rising lower line of 1st it still is in a confirmed and STRONG – bull!
Ok. Lets say the final low of 2018 perhaps was influenced by lower line of 1st support energy. Just a thesis although this price is a little bit away when watching its distance to the lower line of 1st.
The final low of 2019 is in blatant striking distance to the lower line of 1st = support magnet. This month March sell-off low has arrived with an about 98% accuracy at lower line of 1st double arc and this is A) why the lower line of 1st is at least once confirmed and quite certainly confirmed support for having produced a higher bull market low for the year and B) maybe this month low made at 1450.9$ and again blatant close to lower line of 1st support has the potential to be the next higher final year low price of a still running gold bull market which could continue until end of January 2021 because only then the so far very visible support influence of the lower line of 1st officially ends according the time.
Or, active signal state is: ==> GUNNER24 Method points to that the March 2020 bear extreme – no matter if it is already reached at 1450.9$ or, and this is allowed, if it will arrive a little bit below that price with a probability of 80% marks the final low of this year 2020.
A main target for the still not broken yearlong gold bull market is 1725$ to 1722$! And bad news for the world could be again good news for the usually always last safe haven in a recession wave. The gold...:
==> the impending tsunami triggered by Central Banks and Governments bailouts which will flood and hopefully rescue the markets and our civilisation with „free" money infusions, the gold lloks like far higher as just a 1725$ to 1722$! The amount of free money should lead to new alltime-highs for gold at the end of this bull market. should actually carry back much further than just up to this line zone. Normally!
The perhaps most trustful confirmation that we still should believe in the inner strenght of gold until 1725$-1722$ target is finallly worked off is this recognized Fib number madness. Fully pointing to the outcome that 55th Fib number candle of the bull market could resp. should be the next important bull market extreme (always give +/- 1 candle at the high prominent Fib numbers):
8-Fib number top ==> 13-Fib number low ==> 21-Fib number top ==> 33-Low, what is oriented to the 34-Fib number
Accordingly the month of June 2020 still smells like it then will be the 55th month of the at # 1 // 2015 Bear Market Low started bull market. 55 is always important possibly due turn number and in the gold bull case this timer might influence the final highs = or maybe this traffic light triggers the final high of the entire year, or in course of this month another bull market accelleration will be triggered. Who knows the final outcome for sure actually?
Be prepared!
Eduard Altmann


